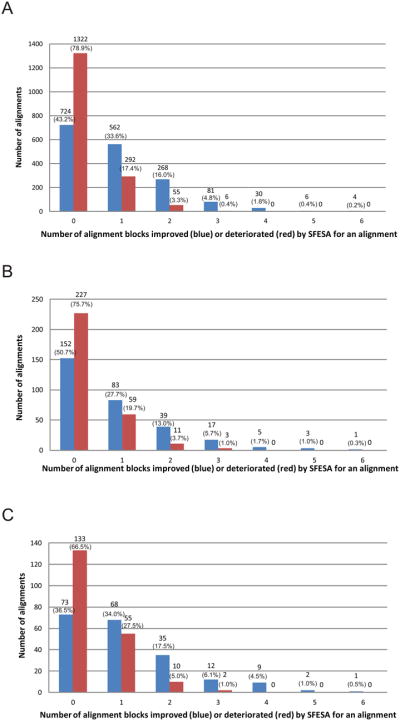
Figure 4. Alignment block-level evaluation of SFESA performance on different datasets.

(A) Evaluation on our training dataset (1675 alignments). (B) Evaluation on the MUSTER benchmark (300 alignments). (C) Evaluation on the SALIGN benchmark (200 alignments). SFESA (O+G+M+S) is used to refine alignments generated by PROMALS and Dali structure alignment is used as the reference. The blue column represents the number of alignments in which a certain number of aligned blocks were improved by SFESA. The red column represents the number of alignments in which a certain number of aligned blocks were deteriorated by SFESA. Columns of the “0” in the x-axis show the number of alignments where none of the alignment blocks were improved (blue) by SFESA and the number of alignments where none of the alignment blocks were deteriorated (red) by SFESA. The number of alignment cases in each category and the percentage is shown above each column.
