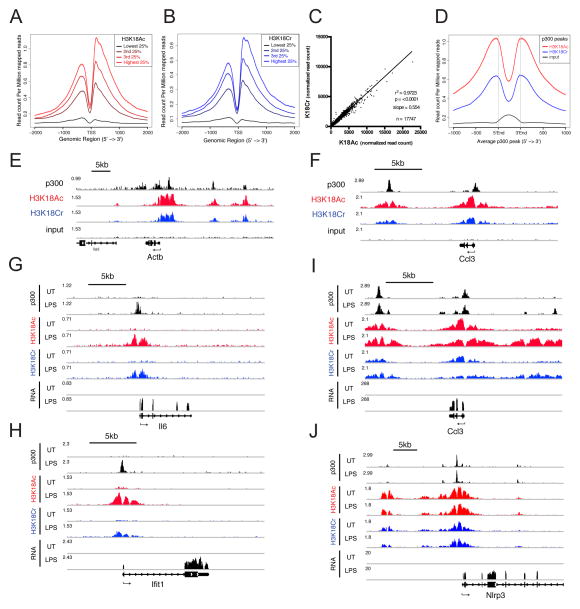
Figure 4. H3K18Cr is Associated With Active Chromatin, Correlates with p300 Peaks, and is Induced at “De Novo-Activated” Regulatory Elements Upon LPS Stimulation.
(A–B) All genes with FPKM >1 were split into 4 equal groups based on their expression levels calculated from RNA-seq of unstimulated RAW 264.7 cells. The average profile of H3K18Ac (A) and H3K18Cr (B) ChIP-seq data from unstimulated RAW 264.7 cells are plotted for each group at TSS +/− 2kb.
(C) Correlation between H3K18Ac and H3K18Cr ChIP-seq read counts within all H3K18Cr peaks (17,747). Plotted as normalized read counts (read counts per million mapped reads).
(D) Average profile of H3K18Ac, H3K18Cr, and input ChIP-seq data from unstimulated RAW 264.7 around all annotated p300 peaks from unstimulated macrophages.
(E–F) Genome browser representation of normalized ChIP-seq reads for p300, H3K18Ac, H3K18Cr, and input from unstimulated macrophages at a “housekeeping” gene (Actb) (E) and a lineage specific constitutively expressed (“pre-activated”) gene (Ccl3) (F). Normalized to total mapped reads. The y-axis maximum is given at the far left of each track. Arrow below refseq gene track indicates directionality of transcription.
(G–J) Genome browser representation of RNA-seq reads and ChIP-seq reads for p300, H3K18Ac, and H3K18Cr from unstimulated (UT) and 120′ LPS-stimulated (LPS) macrophages at two “de novo-activated” genes (Il6 and Ifit1) (G and H, respectively) and two “pre-activated” genes (Ccl3 and Nlrp3) (I and J). Data presented as in (E–F). See also Figure S5.

