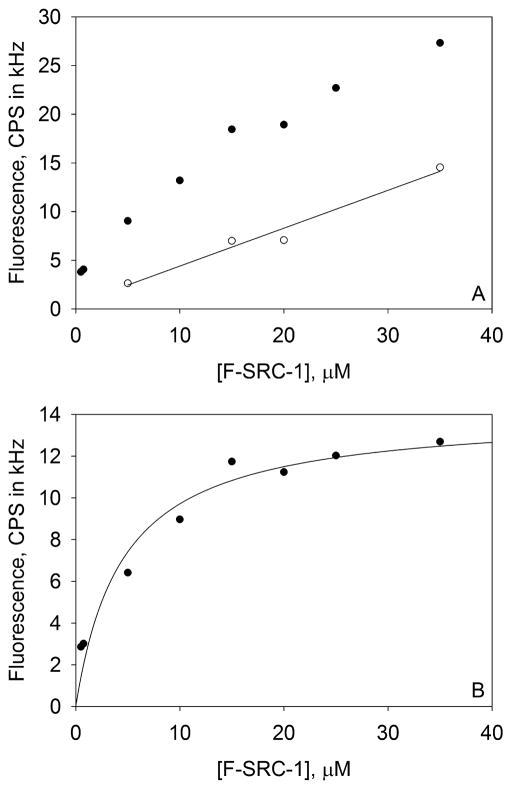
Figure 2.
Representative F-SRC-1–PXR-LBD binding isotherm. These plots, obtained from a single trial, show the surface-associated fluorescence of F-SRC-1 interacting with PXR-LBD in the presence of 1 μM rifampicin. (A) Representative values of F(+) (●) and F(−) (○). (B) Background-subtracted data, F(+) – F(−), curve-fit to the third expression in eq 1, which yields a Kd of 4.5 ± 1.4 μM, where the error is that associated with the fit. The PXR-LBD surface site density is (2.0 ± 0.2) × 103 molecules/μm2.

