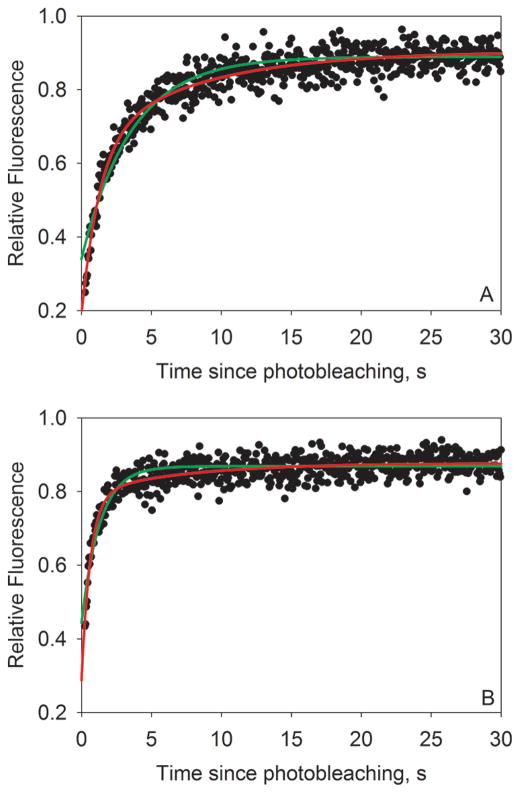
Figure 3.
Representative fluorescence recovery curves. These plots show typical fluorescence recovery curves for (A) 1.25 μM and (B) 20 μM F-SRC-1 interacting with PXR-LBD in the absence of ligand, obtained using a 300 mW, 50 ms bleach pulse. Fluorescence values have been normalized to average prebleach fluorescence values and then fit to one-exponential (green curves; f2 = 0 in eq 2) and two-exponential (red curves; f2 ≠ 0 in eq 2) models. It is evident, especially at the early recovery times, that the two-exponential model is a better fit for the data. All reported values are derived from two-exponential fits. For the curves shown here, the values of f1, k1, f2, k2, and μ were (A) 8.0 ± 0.4 kHz, 0.76 ± 0.08 s−1, 4.3 ± 0.4 kHz, 0.126 ± 0.012 s−1, and 0.88, respectively, and (B) 15.0 ± 0.8 kHz, 1.56 ± 0.13 s−1, 2.5 ± 0.3 kHz, 0.15 ± 0.02 s−1, and 0.83, respectively. The weighted average of the two rate constants, koff, was (A) 0.54 or (B) 1.36 s−1.

