Figure 4.
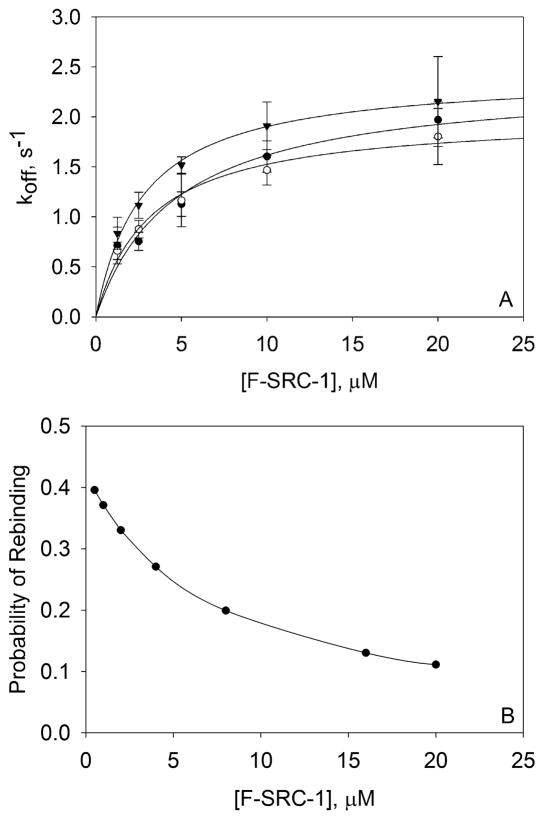
F-SRC-1–PXR-LBD dissociation rate constants measured by TIR-FRAP and theoretical probabilities of rebinding. (A) Four to six recovery curves were measured for each of four (0 μM rifampicin) or three (10 and 100 μM rifampicin) independently prepared samples, for each F-SRC-1 concentration. These measurements were taken using 300 mW, 50 ms; 200 mW, 50 ms; and 100 mW, 100 ms bleach pulses. Each recovery curve was fit to eq 2, and the best-fit values of f1, k1, f2, and k2 were used to calculate koff according to eq 3. The off rates (koff) obtained from the recovery curves pertaining to a single sample were averaged. The points shown in the plot are the averages of three or four of these mean koff values for each F-SRC-1 and rifampicin concentration, with the associated standard deviation. These values of koff as a function of F-SRC-1 concentration, in the absence (○) and presence [10 μM (●) or 100 μM (▼)] of rifampicin, were fit to the model in eq 5. The best-fit values of the intrinsic dissociation rates, , were 2.0 ± 0.1, 2.4 ± 0.3, and 2.4 ± 0.1 s−1 at 0, 10, and 100 μM rifampicin, respectively. (B) Probabilities of rebinding computed by numerically integrating eq 6 from time zero (the center of the bleach pulse) to 30 s (after photobleaching), using the following values: Kd = 4 μM, koff = 2 s−1, S = 3000 molecules/μm2, D = 100 μm2/s, wx = 22.4 μm, and wy = 65.0 μm.

