
FIG. 4.
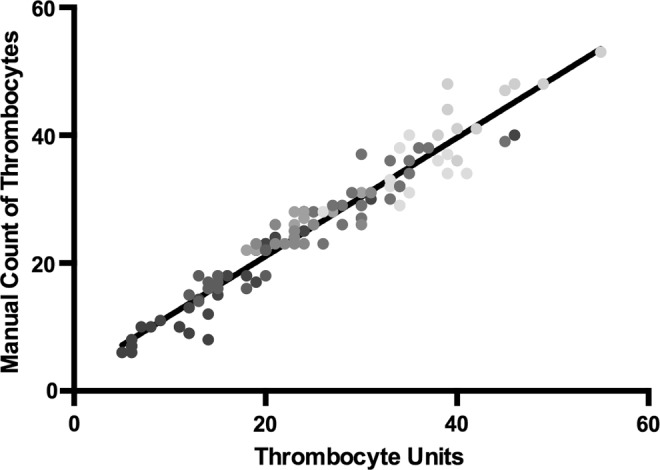
Comparison of manual counts versus TU. Manual counts were performed on 10 frames each of 10 individuals after processing and background subtraction. The results were plotted against the TU from the same frame. Linear regression was performed, yielding an R-square of 0.93.