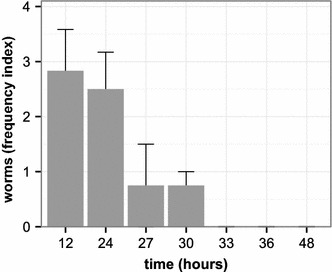
Figure 5.

C. elegans adults in slug feces across time after 3 h of initial exposure to nematode cultures. The experiment was based on nine slugs. Two of these served as negative controls and were not exposed to C. elegans. The remaining seven slugs were exposed to adult C. elegans, revealing a decrease in C. elegans abundance in slug feces over time (X axis). Worms were counted in categories (category 0 = no worms, category 1 = 1–10 worms, category 2 = 11–30 worms, category 3 = 31–50 worms, category 4 = more than 50 worms). For illustration of our findings, we calculated a frequency index for each time point by taking the average of the category scores (which are ordered in size according to worm frequency ranges) across the studied slugs per time interval. The Y axis denotes the calculated frequency indices (±standard error). All scored worms were alive.
