


Figure 1.
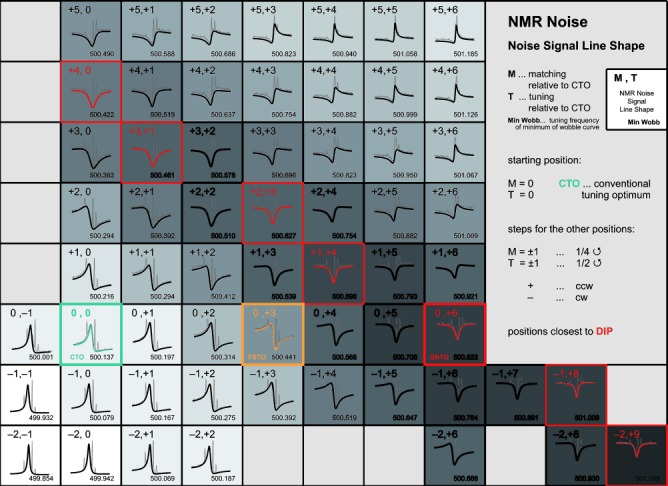
Map of 1H spin noise spectra of the sample acetone:acetonitrile:chloroform (1:0.07:0.17)+5 % [D6]DMSO by volume, recorded on a 500 MHz Bruker DRX spectrometer equipped with a TXI cryo-probe for different tuning and matching positions. The bold traces are noise signals of acetone, which were deconvolved to avoid interference caused by the narrow superimposed signals of the 13C satellites and of acetonitrile. Tuning/matching combinations, where spin noise signals form dips, are indicated by red frames. The FSTO (as found through small-flip angle pulse spectra, see Supporting Information) is highlighted in yellow, while a cyan-colored frame denotes the conventional tuning optimum (CTO), where γB1 is maximum. Different shades of grey indicate the circuit’s thermal noise power level at each position (darker greys correspond to higher values).