


Figure 2.
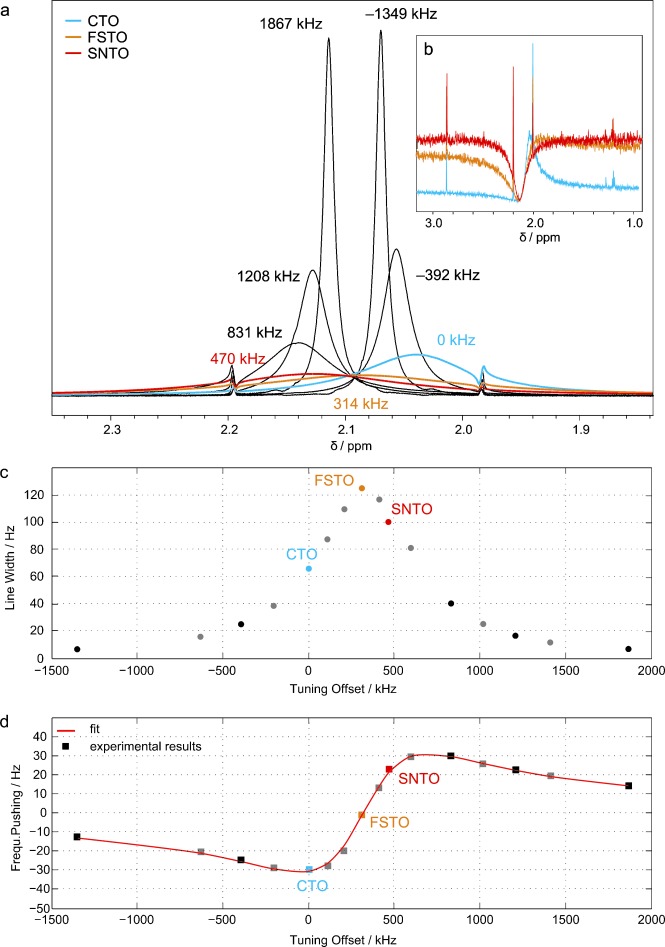
Variation of 1H line shapes and resonance frequency shifts of 90 % of acetone in [D6]DMSO as a function of the tuning frequency of the electronic detection circuit of a 600 MHz cryo-probe. Colors represent different tuning frequencies ranging from −1.4 MHz up to 1.9 MHz relative to the CTO condition, which is shown in cyan. The FSTO and the SNTO conditions are indicated by yellow and red, respectively. To take into account the variation of detection sensitivity due to the tuning offset, the spectra were normalized to the residual 1H2O signal (<0.5 % in [D6]DMSO), whose concentration was sufficiently low not to be affected by radiation damping. Panel (a) shows small flip angle spectra for various tuning positions with numerical values of the corresponding tuning offsets. The inset panel (b) displays the spin noise spectra only at the three characteristic optimum tuning conditions. The observed line widths and frequency shifts are plotted in the panels (c) and (d), respectively, as functions of the tuning offset relative to the CTO, the experimental points correspond to the spectra shown in (a). The best-fit curve to Equation (5) is drawn in red in panel (d). It is represented by a Q of 800, ωFSTO/2 π= 599.596 MHz and  Hz. The observed deviation of the SNTO from the FSTO frequency (ωSNTO−ωFSTO)/2 π=−156 kHz is caused by the feedback field. For clarity, the small flip angle spectra corresponding to the grey dots in (c) and (d) are not included in (a).