Figure 3.

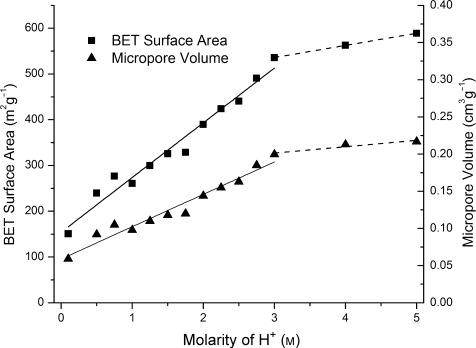
Relationships between BET surface area (left-hand axis) and micropore volume (right-hand axis) under hydrolysis conditions, showing how porosity is continuously tuneable

Relationships between BET surface area (left-hand axis) and micropore volume (right-hand axis) under hydrolysis conditions, showing how porosity is continuously tuneable