
Table 1.
Activator data from a 4MU-GlcNAc cleavage assay for activators 3–6 containing a thienopyrimidine core. 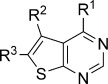
| Compound | R1 | R2 | R3 | AC50 [μm][a] | Maximum activation [%][a] | KM(app) [μm][b] | Vmax(app) [μmol min−1][b] | kcat(app)/KM(app) [m−1 s−1][b] |
|---|---|---|---|---|---|---|---|---|
| – | – | – | – | – | 1700±110 | 0.014±0.001 | 29 000±1800 | |
| 3 | -OEt | -Me | -Me | 575±78 | 284 | 809±120 | 0.022±0.001 | 92 000±9600 |
| 4 |  |
-Me | -Me | 259±24 | 371 | 416±48 | 0.026±0.002 | 210 000±24 000 |
| 5 | |
-H | -Et | 274±12 | 329 | 643±47 | 0.024±0.001 | 125 000±9200 |
| 6 | |
-H | -H | 702±85 | 234 | 649±64 | 0.015±0.002 | 77 500±7700 |
[a]
AC50 values and maximum activation obtained with a titration of activator molecule from 50 μm to 2 mm(substrate concentration=500 μm).
[b]
Apparent kinetic values obtained using a Michaelis–Menten fit with 1 % DMSO across a substrate titration from 50 μm to 2 mm (activator concentration=2 mm).