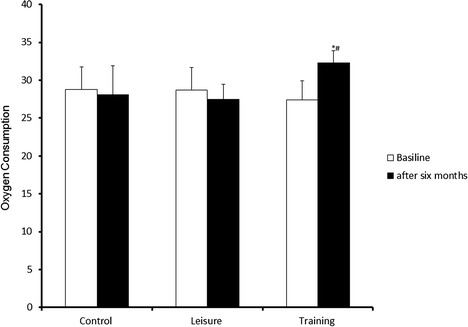
Fig. 1.

Comparison between the training, leisure, and control groups with respect to oxygen consumption. *P < 0.05. ANOVA followed by a post hoc Tukey test, with values expressed as the mean ± SD. *Differs between training vs control; #differs between training vs leisure
