. 2015 Jun 25;4:e06821. doi: 10.7554/eLife.06821

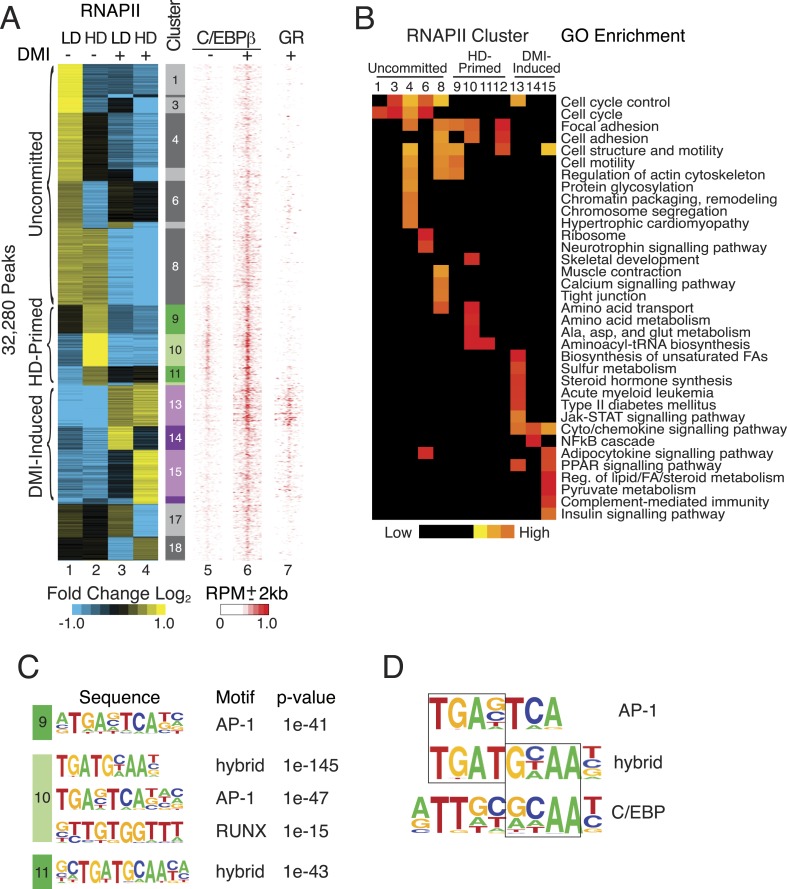
Figure 1. RNAPII-annotated enhancers reveal stage-specific transcriptional programs during adipogenic commitment.

(A) Heat map of RNA Polymerase II (RNAPII) peaks clustered as a function of differential enrichment in response to changes in cell density (low, LD vs high, HD) and differentiation cocktail (+ or − DMI, 24 hr) in human mesenchymal stem cells (hMSCs) (tracks 1–4). Density heat maps (red) of C/EBPβ (0 and 6 hr DMI) and GR (6 hr DMI) binding in hMSCs within a 4 kb window of differential RNAPII peaks (tracks 5–7). Color bar specifically refers to scaling for C/EBPβ tracks. (B) Gene ontologies (GOs) resulting from mapping RNAPII enhancers to genes with correlated changes in gene body RNAPII. (C) Identification of de novo motifs in differential RNAPII clusters 9–11; reported sequences met detection thresholds of at least 5% of targets and p-value ≤ 1e-14. (D) Comparison of the AP-1, hybrid and C/EBP motifs, with the AP-1- and C/EBP-half sites boxed.

DOI: http://dx.doi.org/10.7554/eLife.06821.003

Figure 1.

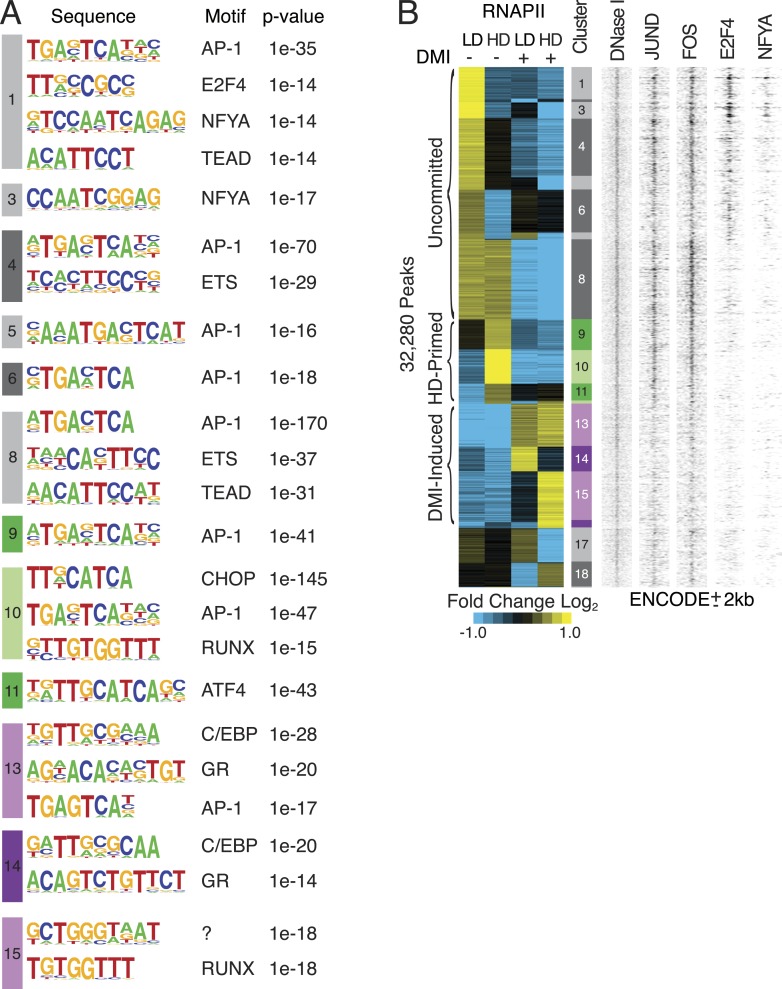
Figure 1—figure supplement 1. Characterization of RNAPII-annotated enhancers.

Figure 1—figure supplement 1.

(A) Identification of de novo motifs in differential RNAPII clusters; reported sequences met detection thresholds of at least 5% of targets and p-value ≤ 1e-14. Note the striking enrichment in clusters 1 and 3 of E2F4 and NF-YA, transcription factors (TFs) with well-established roles in controlling cell cycle progression (Lukas et al., 1996; Benatti et al., 2011; Lee et al., 2011; Fleming et al., 2013), as well as the identification of C/EBP and GR motifs in the DMI-induced clusters. (B) Density heat maps of ENCODE marks at differential RNAPII clusters implying occupancy of motifs by their cognate factors such as AP-1, E2F and NF-YA within the uncommitted clusters.
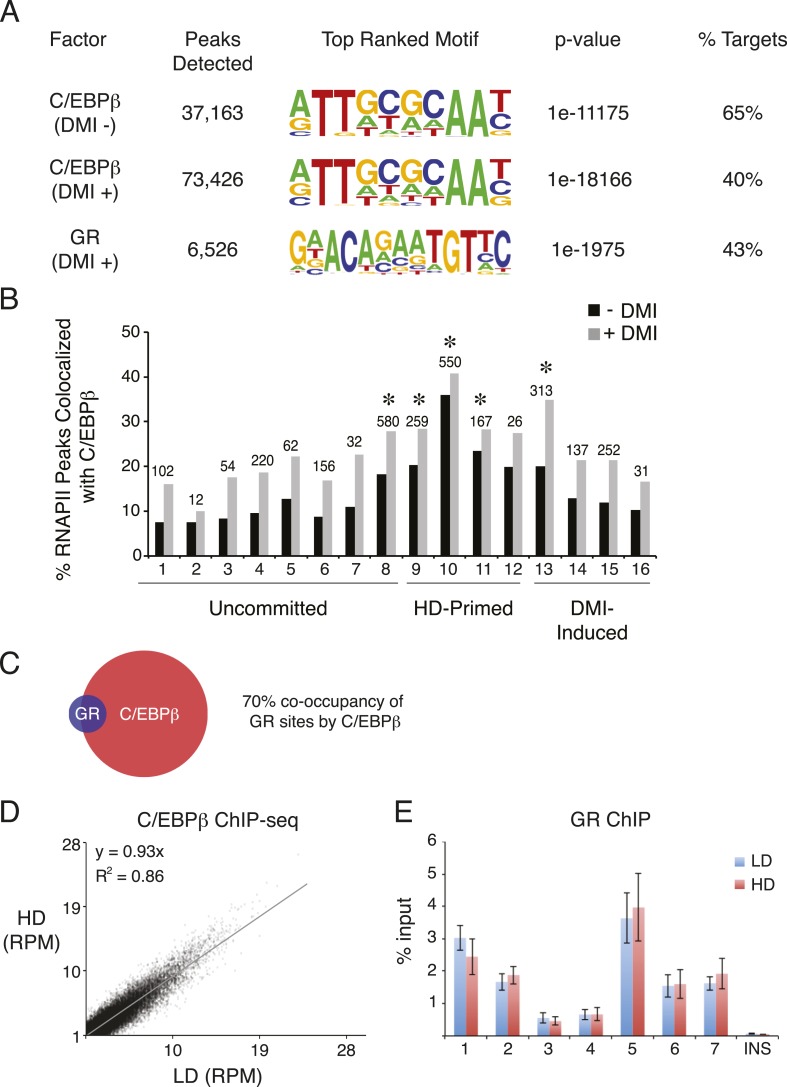
Figure 1—figure supplement 2. C/EBPβ and GR ChIP-seq in hMSCs.

Figure 1—figure supplement 2.

(A) Summary of ChIP-Seq peak calls and de novo motif analyses (HOMER) for C/EBPβ and GR from hMSCs cultured at HD either in the absence or presence of DMI cocktail for 6 hr. (B) Bar graph of differential RNAPII peaks co-localized with C/EBPβ in the presence or absence of DMI, as a function of RNAPII cluster. Absolute number of RNAPII/CEBPβ co-occupied peaks in the absence of DMI treatment is indicated above each bar. *, indicates hypergeometric p-value ≤ 5 × 10⁻⁶ comparing cluster-specific C/EBPβ co-occupancy to the average co-occupancy across all clusters for the DMI-negative condition. Enrichment for C/EBPβ was also statistically significant in the presence of DMI for clusters 8, 10, and 13. (C) Venn diagram showing overlap between the cistromes of GR and C/EBPβ in DMI-treated hMSCs. (D) Scatterplot comparing sequence tags from C/EBPβ ChIP-seq peaks identified in low (LD) and high (HD) density hMSCs treated with DMI for 6 hr. C/EBPβ-binding strength is highly correlated for the two conditions. (E) GR ChIP in DMI-treated hMSCs comparing LD to HD cells at 7 genomic sites and a non-specific control (INS).