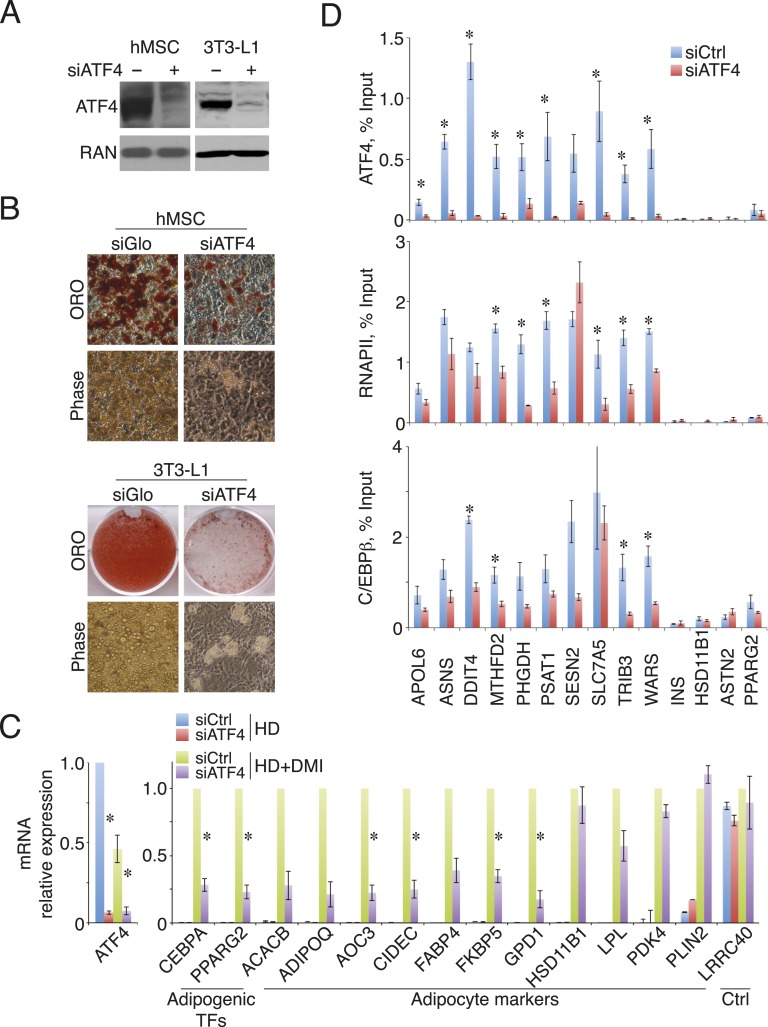
Figure 4. ATF4 promotes adipocyte differentiation and density-dependent transcription.
(A) ATF4 knockdown in hMSCs and 3T3-L1 pre-adipocytes assessed by western blotting. RAN, loading control. (B) hMSCs (top) and 3T3-L1 cells (bottom) were transfected with siATF4 RNA duplexes or control sequences, and assessed for lipid droplet formation following 1 week of adipogenic differentiation. Top images, Oil Red O staining at the level of individual cells (hMSCs) or for an entire well of a 6-well plate (3T3-L1s). Bottom panel, phase contrast images. (C) HD hMSCs were transfected with control (PPIB) or ATF4 siRNAs and assayed for mRNA expression of early adipogenic markers at days 0 (HD) and 3 (HD+DMI) of differentiation. Expression was normalized to the maximum level for the control siRNA. (D) Changes in ATF4 (top), RNAPII (middle) and C/EBPβ (bottom) occupancy as a function of ATF4 knockdown assessed by ChIP in undifferentiated hMSCs cultured at high seeding density. *, denotes p < 0.05. Error bars depict SEM.


