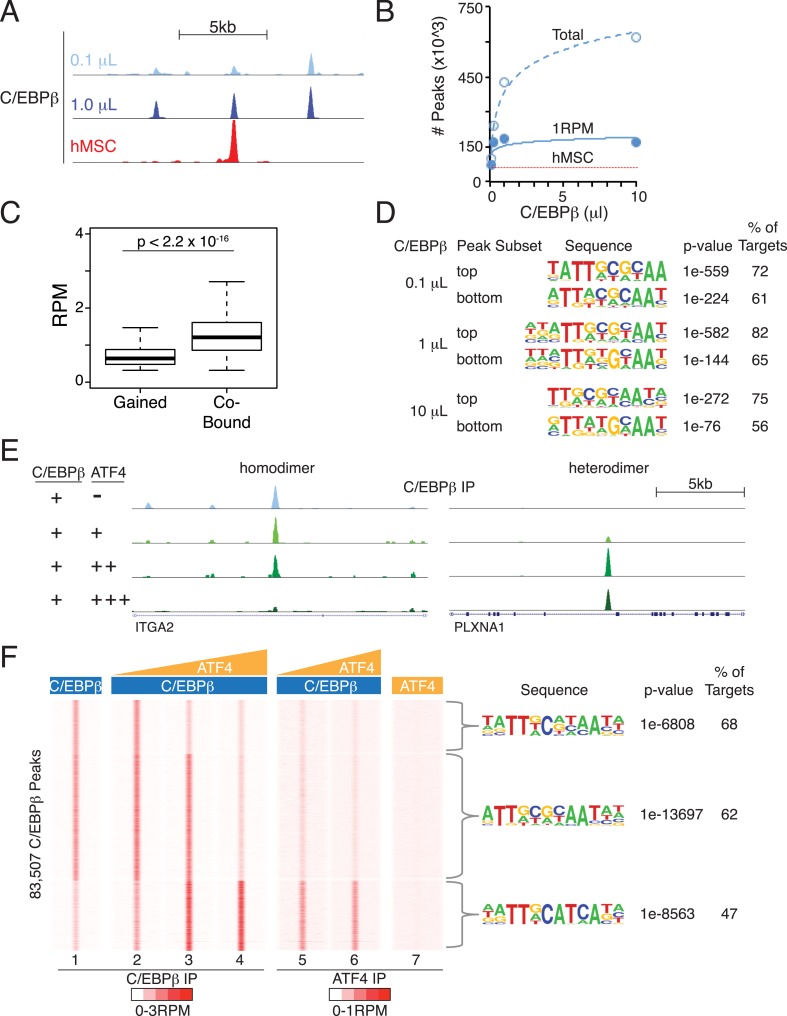
Figure 6. Heterodimer formation with C/EBPβ is necessary for ATF4 binding and is sufficient to alter C/EBPβ-sequence specificity.
(A) Browser shot comparing C/EBPβ peaks from the in vitro cistromics assay (IVC) and hMSC ChIP-seq. 0.1 and 1 μl C/EBPβ molarity equivalents in the initial binding reaction are ∼60 and 600 nM, respectively. Tracks are RPM normalized, y-axes scaled from 0–3 (in vitro) and 0–5 (hMSC). (B) In vitro ChIP-seq peaks total vs a 1 RPM threshold, plotted as a function of C/EBPβ titration (0.1, 0.25, 1 and 10 μl). Total C/EBPβ peaks found in hMSCs (red line) is included for point of comparison. (C) Box plot of peak strength in the 10 μl C/EBPβ cistrome comparing gained vs co-bound sites. The co-bound fraction met a 0.5 RPM threshold in all C/EBPβ homodimer cistromes. (D) Motif enrichment for the strongest- and weakest-1000 sites of the C/EBPβ cistromes. (E) Browser shots of C/EBPβ peaks upon titration of ATF (0.1, 1 and 10 μM) with C/EBPβ (60 nM). Tracks are RPM normalized, 0–3 RPM scale on the left panel, 0–20 RPM on the right. (F) K-means clustered density heat maps of C/EBPβ occupancy as a function of ATF4 titration. Titration of ATF4 (0.1, 1 and 10 μM, C/EBPβ IP; 1 and 10 μM, ATF4 IP) with C/EBPβ (60 nM) is indicated. ATF4 homodimer binding was examined with 250 μM protein. Peaks thresholded to meet 1 RPM in at least two C/EBPβ cistromes. Three discrete clusters were identified and the de novo motif enrichment was based on all sites in each cluster.


