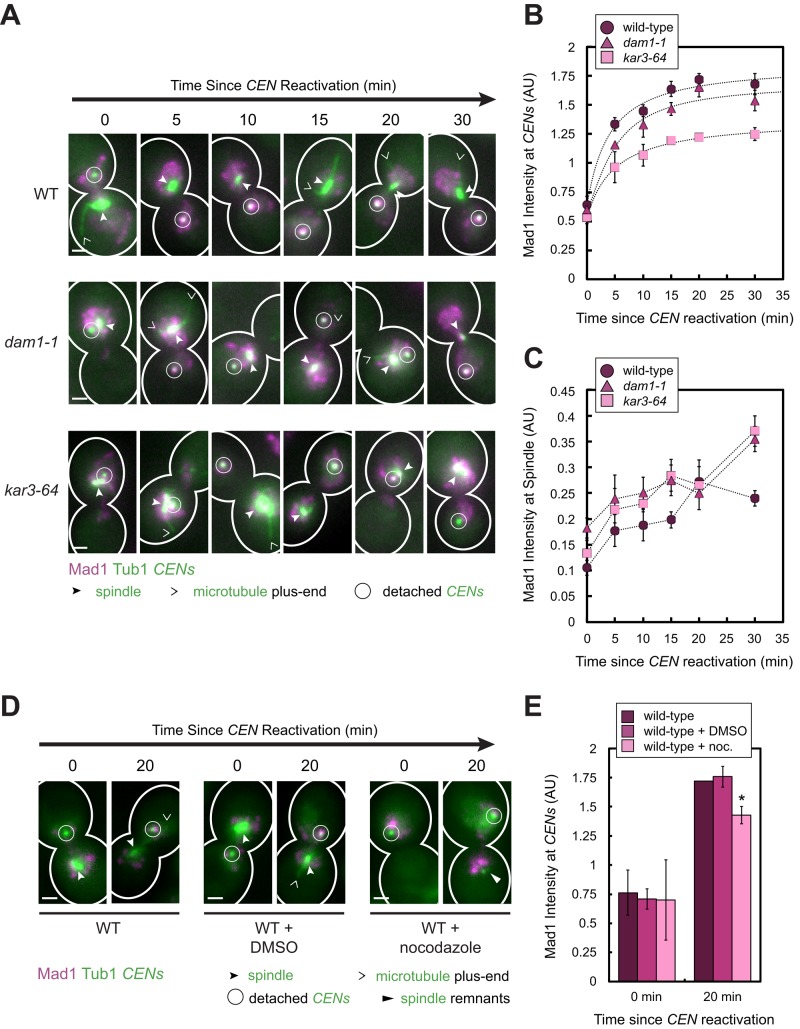
FIGURE 3:
Effect of increasing kinetochore attachment defects on the amount of Mad1 recruited to a single pair of detached sister centromeres. (A–C) Wild-type, dam1-1, and kar3-64 cells expressing Mad1-3×mCherry, GFP-Tub1, and TetR-GFP and bearing MET3pr-CDC20 and GAL1pr-CEN3-TetOs were grown for 2.25 h at 25°C in YP medium plus 2 mM methionine, 2% raffinose, and 2% galactose to synchronize cells in metaphase and to inactivate CEN3. The cells were shifted to 37°C, a restrictive temperature for both mutants, for 45 min and then released into synthetic medium plus 2 mM methionine containing 2% glucose at 37°C. Cells were fixed after centromere reactivation at the indicated time points before imaging by epifluorescence microscopy. (A) Representative MIPs from each strain at each time point. Scale bars, 1 μm. (B) Normalized Mad1 intensity at detached centromeres. Samples included at least 35 centromeres (mean of 94, median 95) for each strain at each time point. (C) Normalized Mad1 intensity at spindles. Samples included at least 174 spindle peaks (mean of 484, median of 458) for each strain at each time point. Mean of three independent experiments is shown in B and C. Error bars represent SEM. Results from these experiments also appear in Figure 6, E and F. (D, E) Wild-type cells were cultured as in A–C, except that the cells were synchronized in metaphase for 3 h at 25°C in the presence or absence of 15 μg/ml nocodazole and/or 1% DMSO. The cells were then released into synthetic medium plus 2 mM methionine containing 2% glucose at 25°C in the presence or absence of nocodazole and/or DMSO and then fixed and imaged as in A–C. (D) Representative MIPs from the strains at each time point. Scale bars, 1 μm. (E) Normalized Mad1 intensity at detached centromeres. Samples included at least 51 centromeres (mean of 125, median 95) for each strain at each time point. Error bars represent SEM. *p < 0.05.

