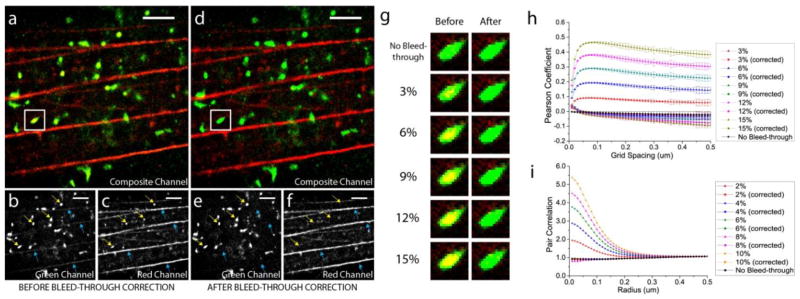
Figure 3.

Demonstration of bleed-through correction on a simulated two-colour FPLM image of HA (green) and actin (red). (a) Composite channel of the image before the bleed-through correction, with its green (b) and red (c) channels. (d) Composite channel of the image after the bleed-through correction, with its green (e) and red (f) channels. Scale bar, 2μm. Width of the box, 0.75μm. (g) HA cluster enclosed in the white box rendered before and after the correction of various bleed-through rates. (h) Pearson coefficient between HA and actin as a function of grid spacing before and after the bleed-through correction. (i) Pair correlation between HA and actin molecules before and after the bleed-through correction (with the use of the calibration curve).
