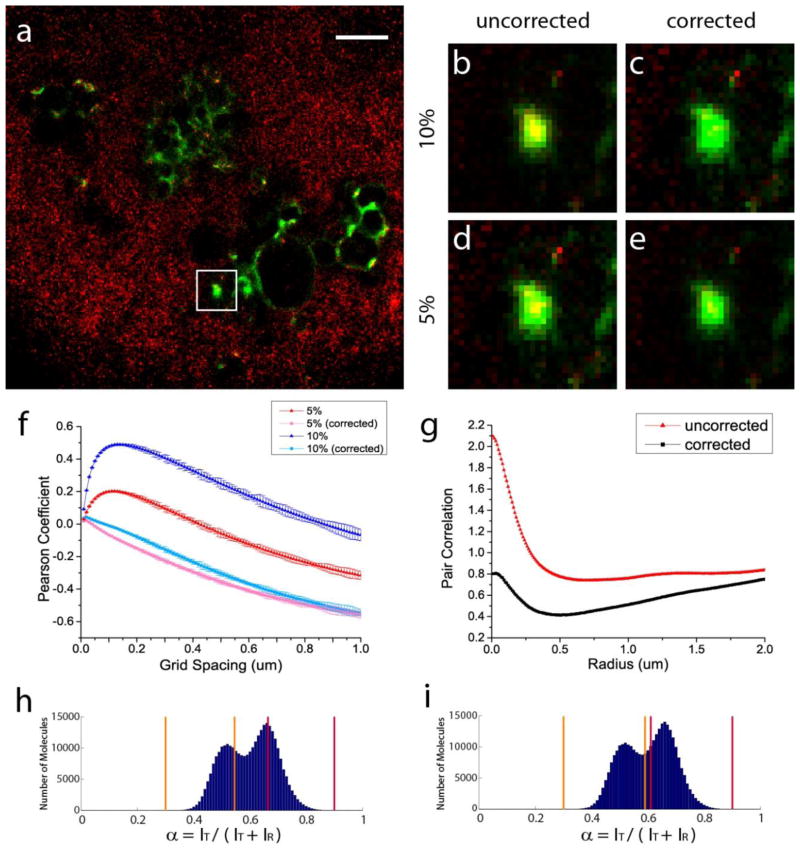
Figure 4.
Demonstration of bleed-through correction on experimental images of Dendra2-HA (green) and PAmCherry-cofilin (red) as an anti-correlated example. (a) Two-colour FPALM image of Dendra2-HA and PAmCherry-cofilin (shown after the bleed-through correction). Scale bar, 2μm. (b–e) HA cluster enclosed in the white box rendered before and after the correction of 5% and 10% bleed-through. Rate of bleed-through from Dendra2 (A) into the PAmCherry channel (B) and the rate of bleed-through from PAmCherry (B) into the Dendra2 channel (A) are equal in both cases: kAB = kBA. (f) Pearson coefficient as a function of grid spacing before and after the correction of 5% and 10% bleed-through rates. (g) Pair correlation between HA and cofilin molecules with and without the bleed-through correction, for kAB = kBA= 0.10. α-value (spectral ratio) ranges used for (h) 5% and (i) 10% bleed-through rates.

