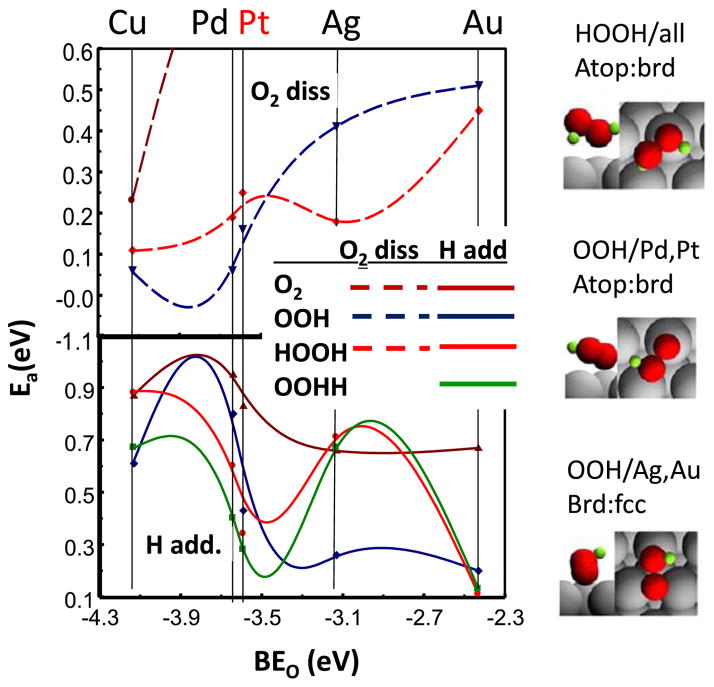
Figure 7.
Activation energies (Ea) obtained from DFT slab calculations for H addition (bottom) and O–O dissociation (top) as reported by Ford et al.61 A least squares interpolation of the Ea’s is indicated between the M atoms. Schematic illustrations of the optimal binding sites of OOH and HOOH on Pt and Ag as estimated from the DFT calculations are indicated at the right. Adapted from Ref. 61 with permission from Elsevier Publishing, 2014.

