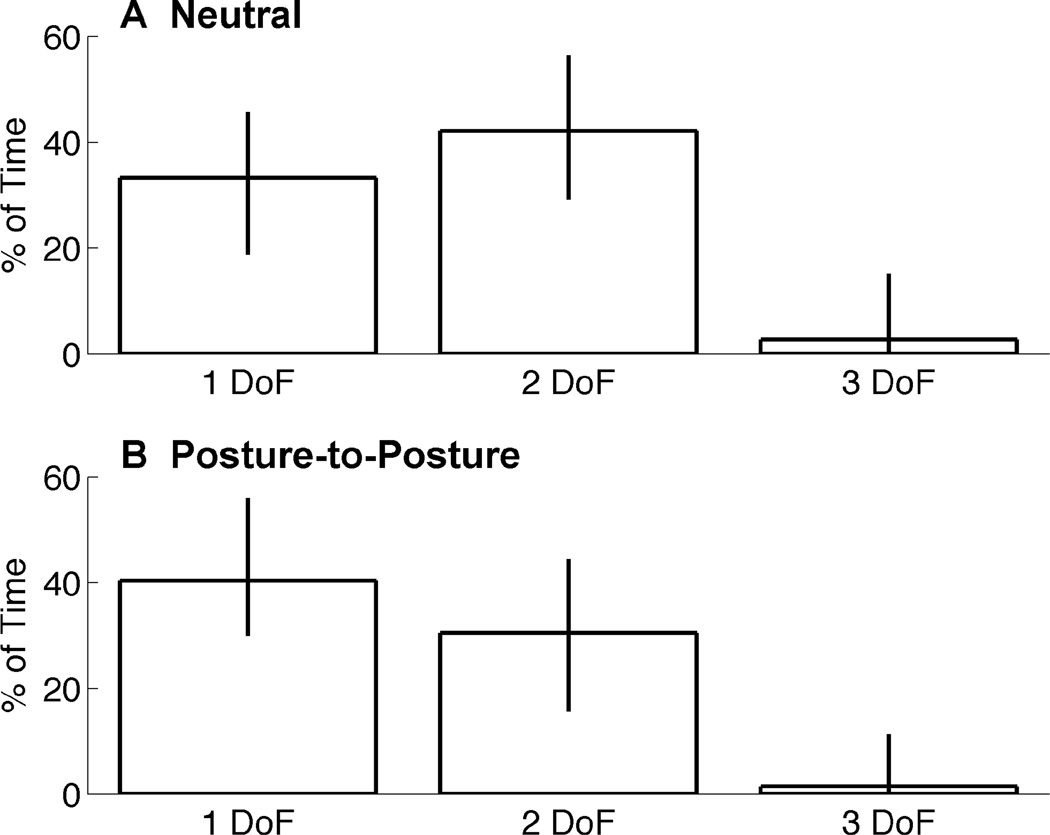
Fig. 3.
Median amount of normalized trial time spent simultanesouly moving DOFs. Data is shown for one, two, and three DOFs together for the Neutral condition tests (top) and Posture-to-Posture condition tests (bottom). Error bars depict inter-quartile range. Fig. 4 Simultaneous DOF percentages during increments of 10% of normalized trial time. Median values are shown for the Neutral condition (top) and Posture-to-Posture condition (bottom) tests. Traces represent No Movement (white), single DOF (green), two DOF (purple), and three DOF (red) movements.

