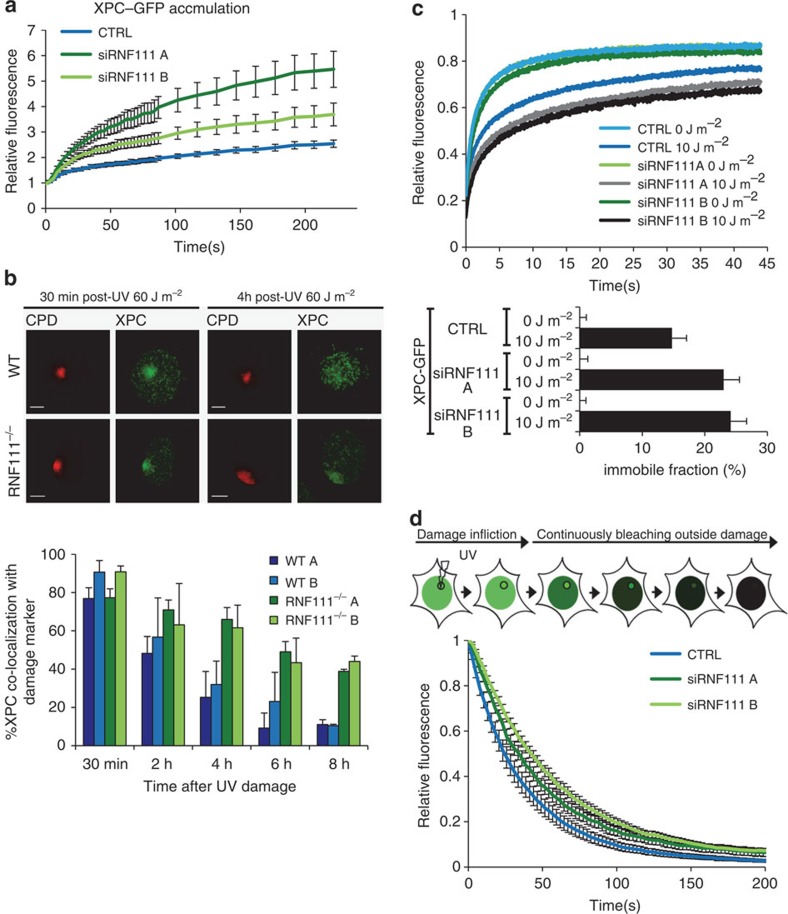
Figure 2. RNF111 is required for XPC release.
(a) Relative XPC–GFP accumulation at sites of LUD in control and RNF111-depleted cells. GFP fluorescence intensity at UV-C laser induced LUD was measured over time using live-cell confocal imaging and quantified to predamage intensity set at 1 at t=0 (n>15 cells per sample, measured in two independent experiments; error bars are the mean±2 × s.e.m.). (b) Top panel: representative immunofluorescence pictures of co-localization of XPC with CPD at LUD in WT and Rnf111−/−MEFs at the indicated time points after UV irradiation (60 J m−2) are shown. Scale bars, 5 μm. Lower panel: quantification of the XPC co-localization with CPD (n>50 cells with LUD were analysed per sample in three independent experiments; error bars are the mean±s.d.). (c) Top panel: FRAP analysis of XPC–GFP in mock treated or global UV-irradiated (10 J m−2) XP4PA (XPC deficient) cells, on transfection with the indicated siRNA's. XPC–GFP was bleached in a small strip within the nucleus and fluorescence recovery was measured over 45 s and normalized to prebleach intensity (n=40; from two independent experiments error bars are the mean±2 × s.e.m.). The immobilized fraction (%)=1−((average fluorescence intensity UV-irradiated cells−the first data point after bleaching)/(average fluorescence intensity unchallenged cells−the first data point after bleaching)), is plotted in the lower panel. The immobilized fraction was calculated over the last 10 s. (d) Inverse FRAP (iFRAP) analysis of XPC–GFP at LUD. XP4PA cells stably expressing XPC–GFP were transfected with the indicated siRNA's. Seventy-two hours after transfection, cells were locally exposed to a 266-nm UV-C laser. After the accumulation plateau was reached (5 min after exposure) the undamaged part of the nucleus was continuously bleached and fluorescence in the damaged area was monitored. Fluorescence was normalized to prebleach intensity (n>15 cells per sample, measured in two independent experiments; error bars are the mean±s.e.m.).

