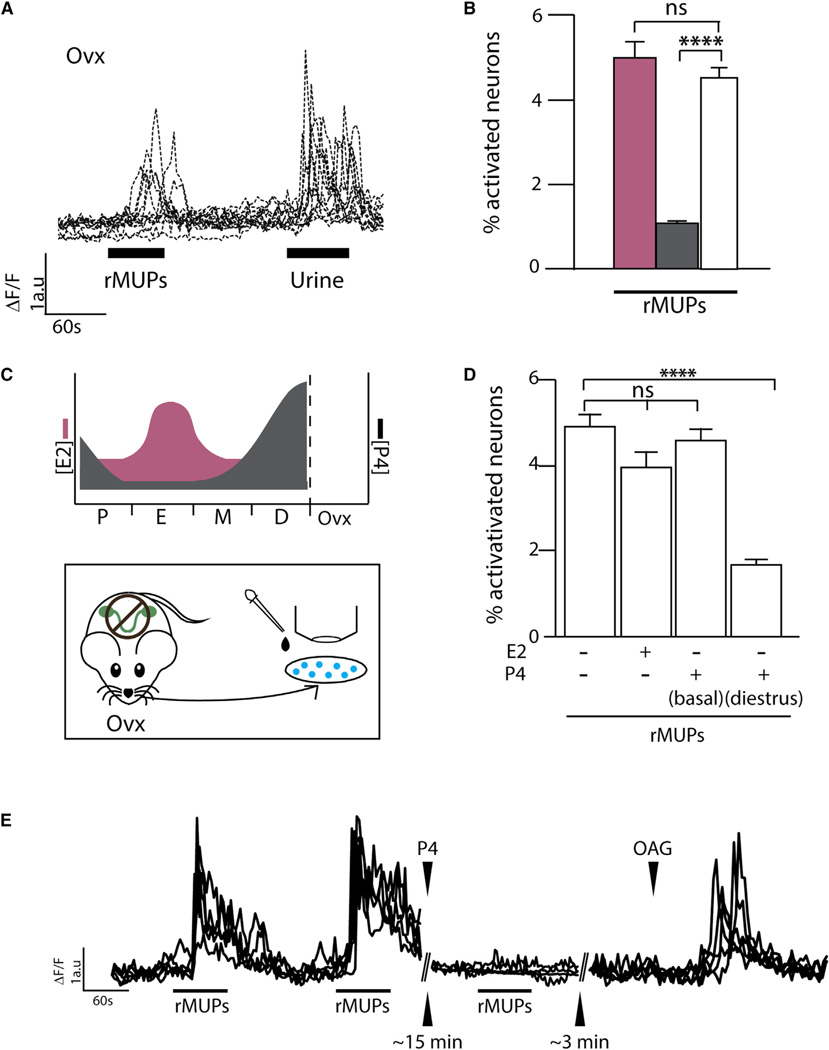
Figure 2. Progesterone Silences Sensory Activity.
(A) Overlaid representative calcium influx traces of individual VSNs from ovariectomized (ovx) females in response to stimulation with rMUPs and male urine.
(B) Percentage of VSNs from ovx females showing calcium influx to rMUPs compared to estrous- and diestrous-staged females (1,939; 2,811; and 2,726 cells imaged, respectively).
(C) Upper panel: representation of estrogen (pink, E2) and progesterone (black, P4) surges in cycling and ovariectomized females (Joshi et al., 2010). Lower panel: experimental design of calcium imaging; acute culture of VSNs from ovx females with the addition of hormones/drugs prior to perfusion of ligand stimuli.
(D) Percentage of VSNs from ovx females showing calcium influx to rMUPs alone or with addition of E2 (200 pM) or P4 at basal (5 nM) or diestrus (40 nM) concentrations (3,292; 2,545; 3,286; 2,712 cells imaged, respectively).
(E) Overlaid calcium influx traces of VSNs responding to consecutive pulses of rMUPs, followed by P4 incubation and third pulse of rMUPs, followed by a pulse of DAG analog, 1-Oleoyl-2-acetyl-sn-glycerol (OAG).
(B and D) One-way ANOVA followed by Bonferroni correction. All values in mean ± SEM. *p < 0.05, **p < 0.01, ***p < 0.001, ****p < 0.0001; ns, not significant. White bars, ovx; pink bars, estrus; dark gray bars, diestrus.
See also Figure S2.

