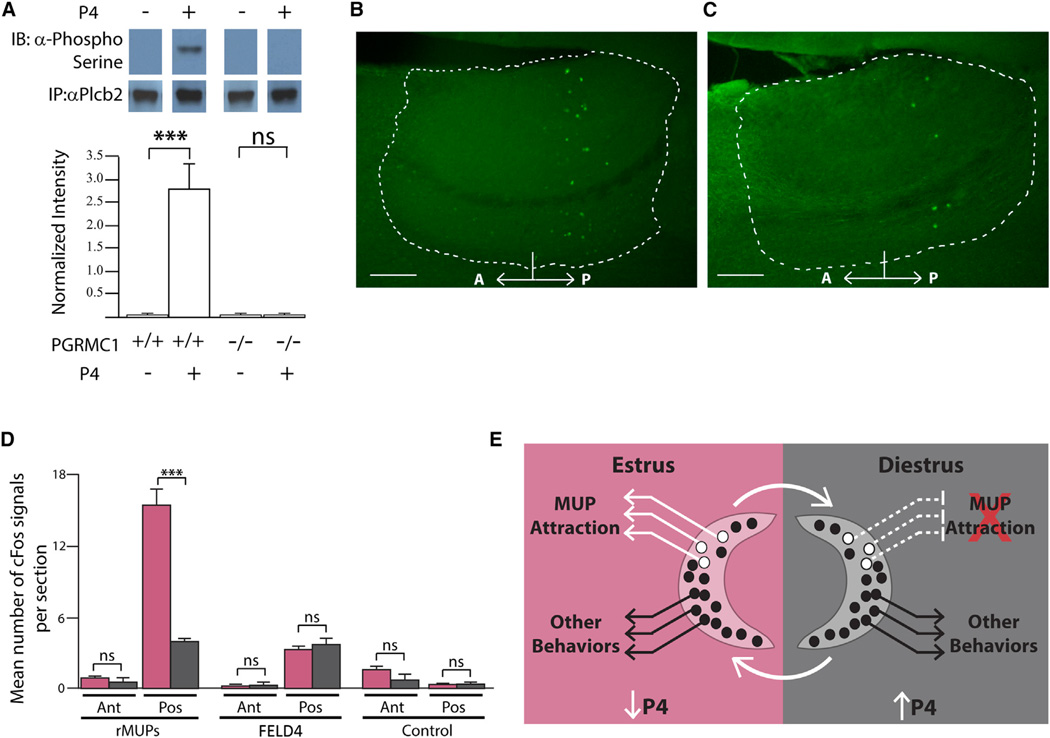
Figure 6. VSN Sensory Silencing Changes Neural Circuit Activity in Accessory Olfactory Bulb.
(A–C) Immunoprecipitation followed by anti-phosphoserine immunoblot for PLCβ2 from VNOs of Pgrmc1fl/flOmpCre/+ and Pgrmc1fl/fl Omp+/+ treated with or without 40 nM P4 (top panel); phosphoserine density normalized to total PLCβ2 density (bottom panel). Sagittal section of accessory olfactory bulb (AOB, dashed white outline) from (B) estrous and (C) diestrous mice showing cFOS expression after two-choice test with rMUPs (A, anterior; P, posterior; scale bars, 100 µm).
(D) Average number of cFOS positive cells in glomerular and mitral layers per section from three animals in each state, following two-choice assay against either rMUPs, FELD4, or no odor control (Ant, anterior; Pos, posterior).
(E) Schematic representation of differences in MUP responsive VSNs in the presence of high P4 during diestrus compared to low P4 during estrus, which results in specific changes in sensory attraction behavior.
(A) Two-tailed t test. (D) One-way ANOVA followed by Bonferroni correction. All values in mean ± SEM. *p < 0.05, **p < 0.01, ***p < 0.001, ****p < 0.0001; ns, not significant. Pink bars, estrus; dark gray bars, diestrus; white bars, ovx.
See also Figure S5.

