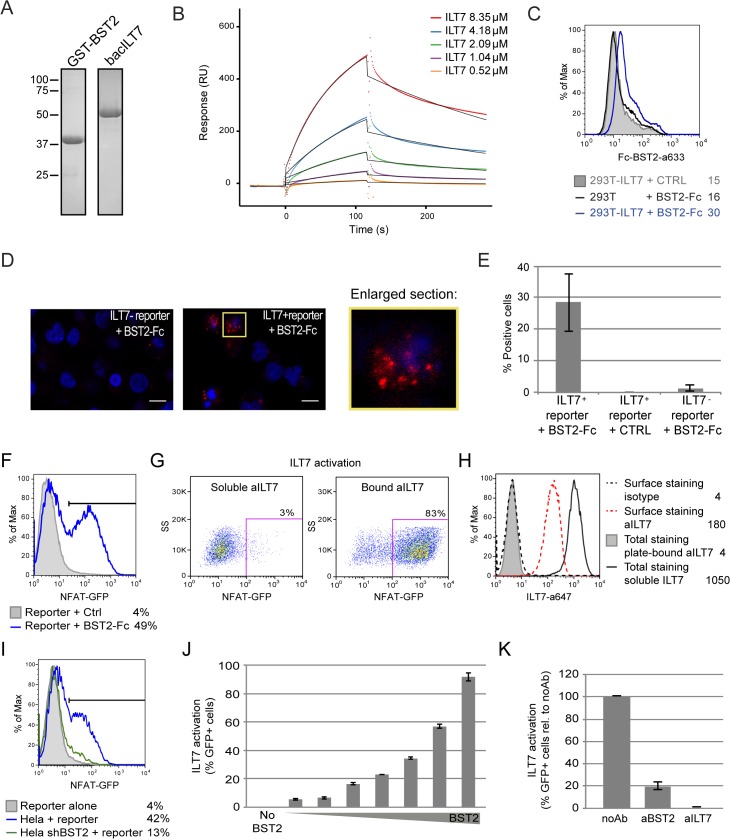
Fig 8. BST2 binds and effectively activates ILT7.
(A-E) BST2 binds ILT7. (A) Purified GST-BST2 and bacILT7 were analyzed by SDS-PAGE and visualized by Coomassie brilliant blue staining. (B) Recombinant GST-BST2 pre-coated on the surface of Biacore sensor chips, was mixed with the indicated concentrations of bacILT7. The kinetic response data after subtracting the value from a reference cell coated with GST alone are shown. Kinetic constants (KD = 2.33 μM, kon = 1.25×10³ M-1s-1, koff = 3.08×10⁻³ s-1) were derived by fitting the data (dotted lines) to a 1:1 Langmuir model (black lines) using local Rmax parameters (chi2 = 14). (C) Control (293T) or ILT7-expressing HEK 293T cells (293T-ILT7) were incubated with control supernatant (CTRL) or with BST2-Fc-containing supernatant (BST2-Fc) prior to crosslinking with DTSSP. Cells were then stained for surface BST2-Fc and analyzed by flow cytometry. (D-E) ILT7+ or ILT7- NFAT-GFP reporter cells were incubated with control supernatant (CTRL) or with BST2-Fc-containing supernatant (BST2-Fc). Proximity ligation assay (PLA) was performed using mouse ILT7 mAb and rabbit polyclonal anti-BST2 Abs. A fluorochrome-labeled probe (red) was used to reveal locations of close proximity, and nuclei were highlighted with DAPI staining (blue). (D) Images were acquired by confocal microscopy using a 63Å~ objective. Images shown are representative of multiple fields. A magnification of the section marked in yellow is shown beside the panel. White bar = 10 μm. (E) The percentage of cells with PLA red staining (% positive cells) was calculated from at least 50 cells per condition. (F-K) BST2 effectively activates ILT7. (F) ILT7+ NFAT-GFP reporter cells were cultured in the presence or absence of plate-bound BST2-Fc for 24 h and analyzed for GFP expression using flow cytometry. (G-H) ILT7+ NFAT-GFP reporter cells were cultured in the presence of plate-bound or soluble anti-ILT7_alexa647 Abs (grey shaded or solid black histograms, respectively) or soluble isotype_alexa647 Ab as negative control (dotted lines). Twenty-four hours later, cells were harvested and samples in contact with the isotype Ab were stained for surface ILT7 only, using the above mentioned Abs for 30 min at 4°C (isotype_alexa647: dotted black histogram and aILT7_alexa647: dotted red histogram). All sample were analyzed by flow cytometry to detect (G) the percentage of GFP positive cells and (H) anti-ILT7 Abs (surface or total: surface + internalized). (I-K) ILT7+ NFAT-GFP reporter cells were co-cultured for 24 h with (I) control Hela or BST2-depleted Hela (Hela shBST2) cells or (J-K) HEK293T cells expressing either (J) increasing amounts of BST2 or (K) a fixed amount of BST2 and analyzed by flow cytometry (n = 2). (K) Prior to co-cultures, HEK293T-BST2 cells were incubated with rabbit anti-BST2 Abs (aBST2) or ILT7+ NFAT-GFP reporter cells were incubated with anti-ILT7 Abs (aILT7) for 1h or cells were left untreated as control (noAb). Relative percentage of ILT7 activation was plotted as % of GFP+ cells in each condition relative to the no Ab condition, which was set at 100%. Error bars represent SD.

