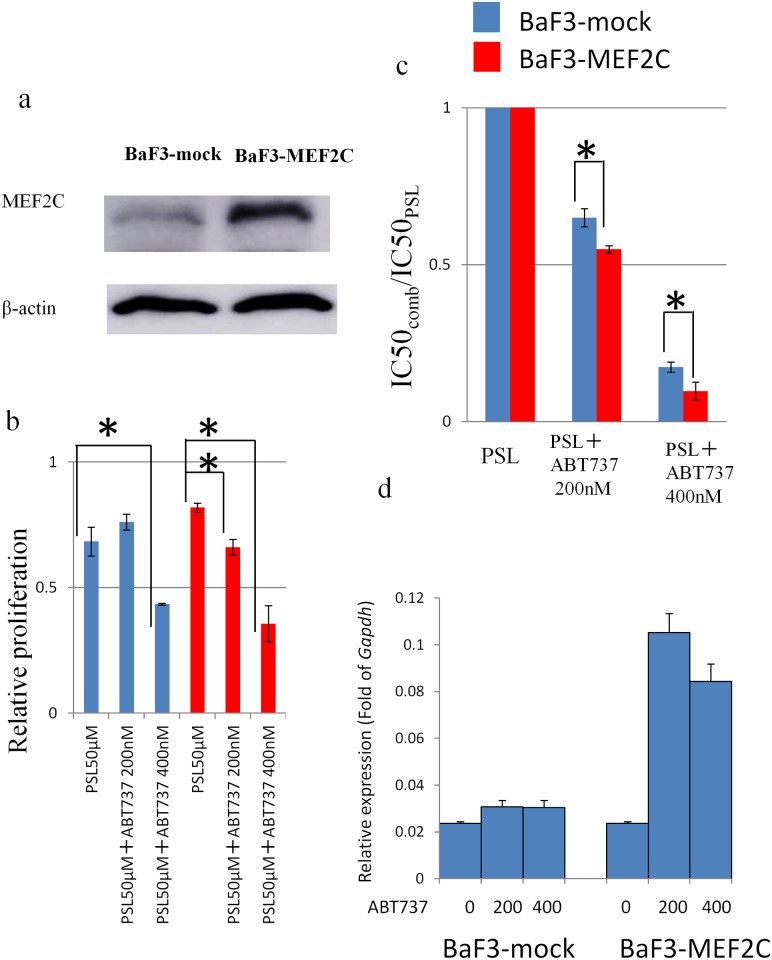
Fig 3. Comparison of BaF3-MEF2C vs. BaF3-mock cells.
(a) Expression of MEF2C and β-actin determined by western blot analysis. (b) The number of viable cells assessed using WST assay following incubation, with PSL (50 μM) and/or ABT-737 (200 and 400 nM). (c) Calculation of the IC50 of PSL when treated with PSL alone, or with a combination of PSL and ABT-737 (200 or 400 nM). P-value of less than 0.05 was considered statistically significant. *: p< 0.05. (d) q-PCR analysis of Bcl2 of two cell lines 12 hours after treatment of ABT-737 with the concentration of 200 or 400 nM. The bar indicates the mean±SE of two independent experiments in triplicate.

