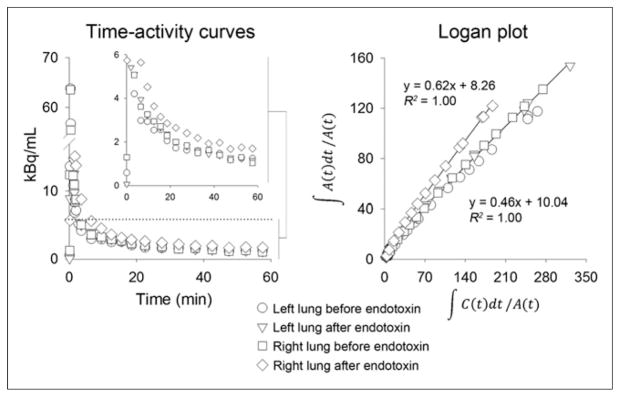
FIGURE 4.

Time–activity curves and Logan plots from images (VOI) in Figure 3. Last 12 data points (last 50 min of image acquisition) were used for Logan plot linear regression for all scans. Inset shows later time points of curve focused on lower range activity to better illustrate differences in activity among different VOIs. Units for Logan plot axes: x-axis = mL blood/mL lung × min; y-axis = min.
