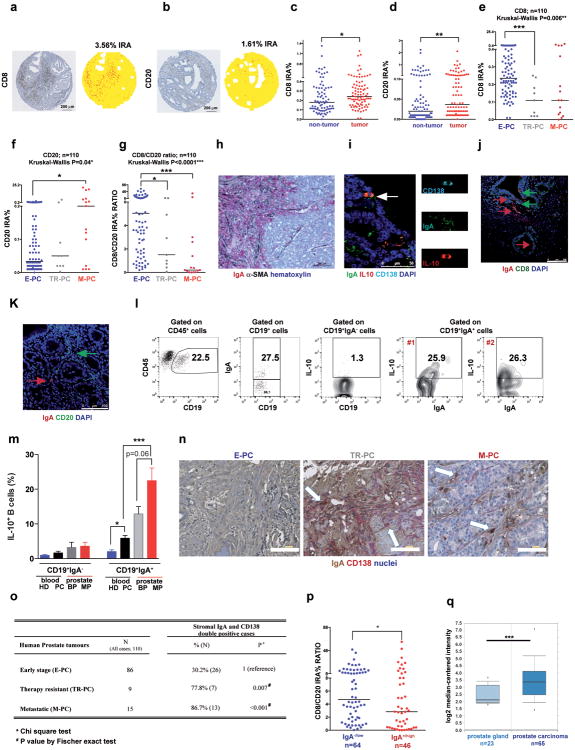
Extended Data Figure 6. Analyses of B and T cells in human prostate cancer specimens.
a-h, Tissue microarrays of tumor and non-tumor tissue from 110 PC patients were stained for CD8 and CD20 (5-6 spots/patient = 3-4 tumor tissue + 2 non-tumor tissue). a,b, Representative examples of CD8 (a) and CD20 (b) IHC of PC tissue microarrays (left). Magnification bar: 200 μm. Right, computer assisted image analysis with ad hoc developed image software. Tumor tissue is represented in yellow and CD8+ and CD20+ cells are represented in red. The percentages of immune reactive area (IRA) occupied by CD8+ or CD20+ cells are shown. Magnification bars: 200 μ. c,d, comparison of CD8 and CD20 IRAs in matched non-tumor and tumor tissues from each early stage PC (E-PC) patient (n=87). e-h, Patients were divided into three subgroups: E-PC (n=86); therapy-resistant-PC (TR-PC; n=9), and metastatic-PC (M-PC; n=15). e, CD8+ cell infiltration into tumor tissues of the different groups. f, CD20+ cell infiltration into tumor tissues of the different groups. g, The CD8+/CD20+ ratio for the different groups. Each dot represents one patient. Line indicates the median value. Mann-Whitney test was used to calculate statistical significance between the two groups. Kruskal-Wallis test was used to calculate statistical significance between the three groups. h, IHC analysis of low risk (n=5) and high risk (n=5) human PC specimens using IgA (red) and αSMA (black). Nuclei were counterstained with hematoxylin. Magnification bar: 100 μm i, IF analysis of human PC showing IL-10 (red) –expressing IgA+ (green) CD138+ (turquoise) plasma cells (n=6). Representative images are shown. White arrow indicates IL-10-expressing IgA+ cells. Magnification bars: 50 μm. j, Human normal prostate (n=3-5), and human PC (n=5), were stained for IgA and CD8. Typical images are shown. Red and green arrows indicate IgA+ and CD8+ cells, respectively. Magnification bar: 100 μm. k, Human normal prostate (n=3), and human PC (n=5), were stained for IgA (red arrow) and CD20 (green arrow). Magnification bar: 100 μm. l, Flow cytometric analysis of human prostate tumor-infiltrating CD19+ B cells and IgA+ cells. The percentages of IL-10-expressing B cells in CD19+IgA+ (2 different samples) and CD19+IgA- B cells are shown. m, Summary of results obtained from human blood samples taken from healthy donors (n=3) and PC patients (n=5) and prostate tissue specimens (benign, malignant; n=4) analyzed by flow cytometry for IL-10 expression in CD19+IgA- and CD19+IgA+ B cells. n,o, Tissue microarrays from 110 PC patients (described above) were stained for IgA and CD138. Patients were divided into three subgroups: E-PC (n=86); TR-PC (n=9), and M-PC (n=15). (n) Representative images of IgA (immunoperoxidase) and CD138 (alkaline phosphatase) double staining of tumor tissues from each group. CD138+ and IgA+ double positive cells in the PC stroma are indicated by the white arrows (hematoxylin counterstain). Magnification bar: 100 μm. o, Frequencies of IgA+ and CD138+ double positive cells in the tumor stroma of the different PC patient groups. p, PC patient specimens were divided into two groups: IgA-/low (n=64) and IgA+/hi (n=46). Shown is the CD8+/CD20+ ratio for each group. Each dot represents one patient. Line indicates the median value. q, IgA mRNA expression (IGHA1) is significantly elevated in human PC tissue relative to healthy or benign prostate tissue in 5 out of 15 studies evaluated via Oncomine. Results from one significant study14 are presented. Chi square test and Fischer exact test were used to calculate statistical significance shown by *P, 0.05; **P, 0.01; ***P, 0.001.

