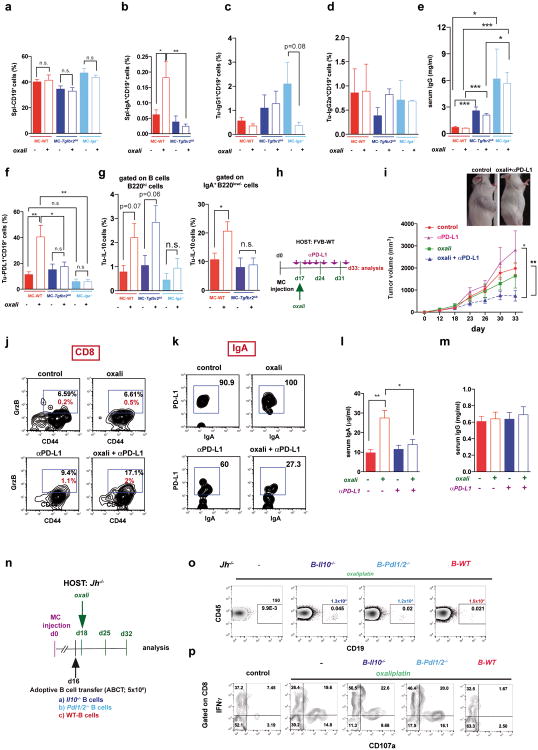
Extended Data Figure 7. Effects of TGFβR2, IgA, PD-L1 and IL-10 ablations on tumor-infiltrating lymphocytes.
MC tumors were raised in WT, Tgfbr2ΔB or Iga-/- mice (n= 5-11/group). Mice were subjected to 3 cycles of late oxaliplatin treatment after which splenic (Spl) and tumoral (Tu) B cells were analyzed. After dead cell exclusion, splenic (a,b) and tumoral (c,d) B cells were stained with CD19, B220, IgA, IgG2a and IgG1 antibodies and analyzed by flow cytometry. e, Serum IgG concentrations in control or oxaliplatin-treated WT, Tgfbr2ΔB or Iga-/- mice bearing MC tumors (n=5-9/group). f, Flow cytometry of tumor-infiltrating CD19+ B cells from WT, Tgfbr2ΔB or Iga-/- MC tumor-bearing mice (n=4-7/group) analyzed for PD-L1 expression, revealing lower PD-L1 surface expression on Tgfbr2Δ and Iga-/- B cells after oxaliplatin treatment. g, Flow cytometry of tumor-infiltrating B220hi B cells (left) and IgA+B220low B cells (right) from WT, Tgfbr2ΔB or Iga-/- MC tumor-bearing mice (n=4-7/group) analyzed for IL-10 expression, revealing no difference in IL-10 expression by B220hiIgA- B cells in the corresponding groups, and lower IL-10 expression by Tgfbr2Δ B cells after oxaliplatin treatment compared to WT mice. Results are means ± s.e.m. Mann-Whitney and t tests were used to calculate statistical significance. h, The experimental scheme. WT mice bearing MC tumors were divided into four treatment groups (n=7-8/group): 1) isotype control (IgG2a); 2) oxaliplatin (weekly); 3) anti-PD-L1 (twice weekly); 4) oxaliplatin plus anti-PD-L1 (weekly and twice weekly, respectively). After 3 treatment cycles, mice were sacrificed and analyzed. i, Tumor growth curves of tumor-bearing mice and gross appearance of untreated and treated mice. Significance was determined by Mann-Whitney and t tests. j, Flow cytometric analysis for GrzB expression by tumor-infiltrating CD8+ T effector cells (CD8+CD44+) from MC tumor-bearing mice treated as described above. Results are shown either as percentages of GrzB+ cells amongst CD8+ T cells (black), or percentages of GrzB+CD8+CD44+ T cells amongst tumoral CD45+ cells (red). k, Flow cytometry of PD-L1 expression on tumor-infiltrating IgA+ CD19+ B cells in the different treatment groups. l,m, Serum IgA (l), and IgG (m) concentrations in the different treatment groups described in panel h. n, The experimental scheme for the experiment whose results are shown in Fig. 4g,h. B cells were isolated from WT, Pdl1/2-/- and Il10-/- mice and 5 × 10⁶ cells (purity 98%) were i.p. transferred into MC tumor-bearing Jh-/- mice (16 days after MC cell inoculation). After 2 days (day 18), the mice were given 3 oxaliplatin treatment cycles and analyzed. o, Flow cytometric analysis of splenocytes after staining with CD45 and CD19 antibodies, confirming presence of B cells in the ABCT groups. Shown are percentages and absolute B cell numbers in spleen. p, Tumor infiltrating CD8+ cells from MC tumor-bearing Jh-/- mice transplanted with B cells and treated as above were re-stimulated for 4 hrs with PMA/ionomycin before flow cytometry (n=4-6 mice/group). Results are means ± s.e.m. Mann-Whitney and t tests were used to calculate statistical significance.

