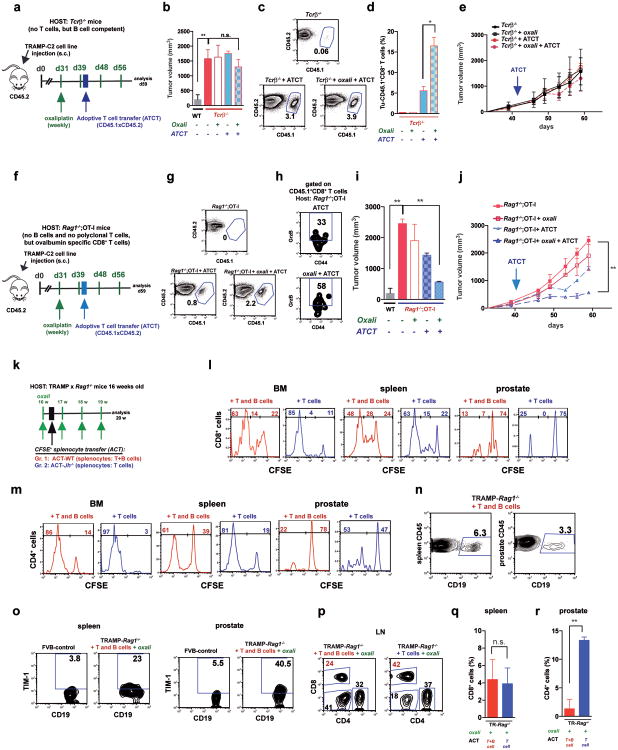
Extended Data Figure 9. Immunogenic chemotherapy supports adoptive T cell transfer only in the absence of B cells.
a, The experimental scheme. Immunogenic TRAMP-C2 cells were s.c. inoculated into WT or Tcrβ-/- mice. After 30 days, the mice were divided into 4 groups (n=4-5/group): 1) control, 2) oxaliplatin (weekly), 3) ATCT, 4) ATCT plus oxaliplatin (weekly). The first oxaliplatin cycle was given at day 31. Two days after the second cycle, CD8+ T cells from CD45.1×CD45.2 WT mice (3 × 10⁶ cells) were transferred into tumor-bearing mice and this was followed by two more oxaliplatin cycles after which mice were sacrificed for analysis on day 59. b, Tumor volumes (mm3) c,d, Flow cytometric analysis of spleen (c) and tumor (d) cells after staining with CD45.1, CD45.2, CD8 and TCRαβ antibodies, confirming expansion of adoptively transferred T cells. e, tumor growth curves. f, The experimental scheme. Immunogenic TRAMP-C2 cells were s.c. inoculated into WT or Rag1-/- × OT-1 mice (no B cells), that harbor CD8+ T cells specific for chicken ovalbumin which is not expressed by TRAMP-C2 cells. After 30 days, tumor-bearing Rag1-/- × OT-1 mice were divided into 4 groups (n=3-4 mice per group): 1) control, 2) oxaliplatin treatment, 3) ATCT, 4) oxaliplatin treatment plus ATCT. The first oxaliplatin cycle was given at day 31. Two days after the second oxaliplatin cycle, CD8+ T cells (3 × 10⁶) from CD45.1×CD45.2 mice were adoptively transferred into tumor-bearing mice, which were sacrificed on day 59 and analyzed. g, Flow cytometric analysisof tumor-infiltrating cells stained with CD45.1, CD45.2, CD8 and TCRαβ antibodies, confirming infiltration of adoptively transferred T cells. h, Flow cytometric analysis of GrzB expression in adoptively transferred, tumor-infiltrating, CD8+ effector cells (CD45.1+CD8+CD44+) from tumor-bearing mice treated as above. i, Tumor volumes (mm3). j, tumor growth curves. k, The experimental scheme for Fig. 5a-f. Sixteen weeks old TRAMP;Rag1-/- mice (no B and T cells) were treated with oxaliplatin (weekly). One day after the 1st treatment cycle, CFSE-labeled splenocytes from either WT (B and T cells, SP-WT) or Jh-/- (T but no B cells, SP-Jh-/-) mice were transferred into the tumor-bearing mice (5 × 10⁶ T cells per mouse; 4-5 mice per group). l, m, After 6 days, one mouse from each group was sacrificed, and the proliferation of CD8+ (l) and CD4+ (m) T cells in bone marrow (BM), spleen and prostates was analyzed by CFSE staining and flow cytometry. n-r, After 3 more oxaliplatin cycles (4 weeks in total), the mice were sacrificed and analyzed. n, Frequency of adoptively transferred CD19+ cells amongst CD45+ cells in spleens and prostates 30 days after ACT. o, Flow cytometric analyses of CD19+ B lymphocytes for TIM-1 expression in spleens (left) and prostates (right) of abovemice. p-r, Flow cytometric analyses of T lymphocytes. Percentages of CD8+ and CD4+ T cells in LN (p); spleens (q); prostates (r) of above TRAMP;Rag1-/- mice. Red:splenocytes from WT mice (T and B cell transfer), blue: splenocytes from Jh-/- mice (T cell transfer). Results are means ± s.e.m. Mann-Whitney and t tests were used to calculate statistical significance.

