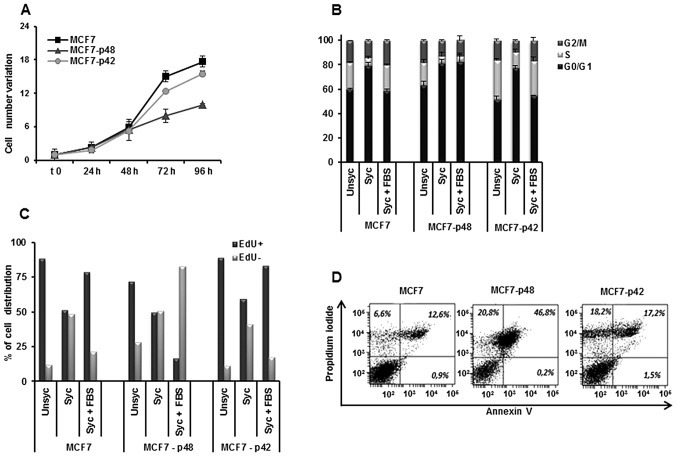
Figure 3.
Proliferation phenotype of MCF7 breast carcinoma cells overexpressing p42 and p48 EBP1 isoforms. (A) Growth rates evaluated at different time-points (h). (B) Analysis of cells distribution in G2/M, S and G0/G1 phases of the cell cycle. (C) Analysis of cell distribution following EdU incorporation. (D) Quantitation of apoptotic cells by double staining with Annexin V and PI.

