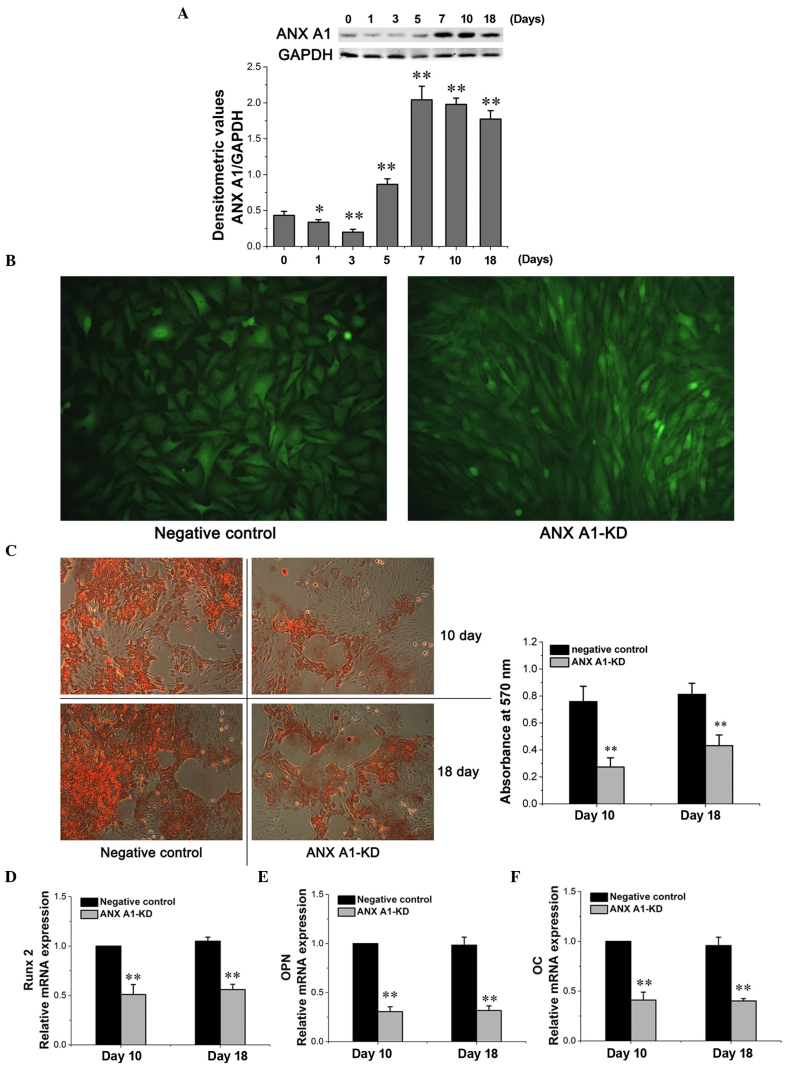
Figure 3.
Knockdown of ANX A1 by shRNA resulted in reduced differentiation of BM-MSCs. (A) Analysis of ANX A1 protein expression during osteogenesis. GAPDH served as an internal control and the quantitative analysis of ANXA1 expression was performed by densitometry. The amount of ANXA1 was normalized to the amount of GADPH. Quantitative analysis of the ANX A1 protein expression is presented in the bar chart. *P<0.05 and **P<0.01 vs. day 0 (n=5 per group). (B) The shape of the negative control BM-MSCs became angular during osteogenesis compared with the ANX A1-KD BM-MSCs (magnification, ×200). (C) Analysis of Alizarin red S staining and quantification of matrix mineralization (magnification, ×100). Knockdown of ANX A1 significantly inhibited calcified matrix synthesis. (D–F) Silencing of ANX A1 by shRNA significantly suppressed Runx2, OPN and OC gene expression. **P<0.01 vs. the negative control, as determined by one-way analysis of variance, n=5 per group. KD, knockdown; ANX A1, Annexin A1; shRNA, short hairpin RNA; BM-MSC, bone marrow-derived mesenchymal stem cells; GAPDH, glyceraldehyde 3-phosphate dehydrogenase; Runx2, runt-related transcription factor 2; OPN, osteopontin; OC, osteocalcin.

