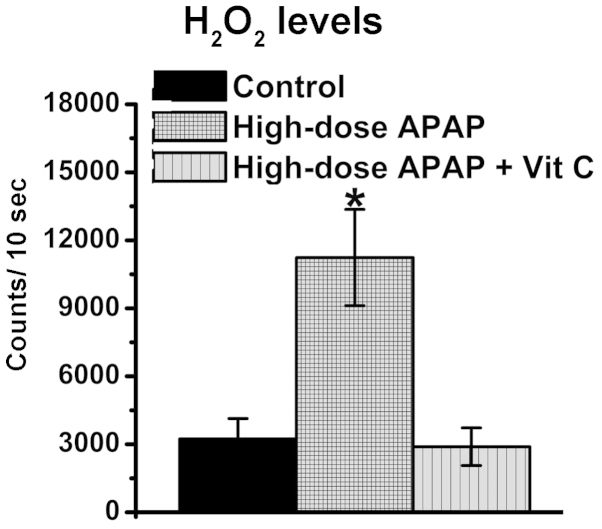
Figure 6.
H2O2 levels. The levels of H2O2 levels were determined in the control, high-dose APAP-treated and high-dose APAP + 0.5 mM vit C-treated cells. The levels of H2O2 were measured after 1 h treatment. Data were analyzed from four independent experiments and are presented as the means ± standard deviation.*P<0.05, compared to the control group. H2O2 hydrogen peroxide; APAP, acetaminophen; vit C, vitamin C.

