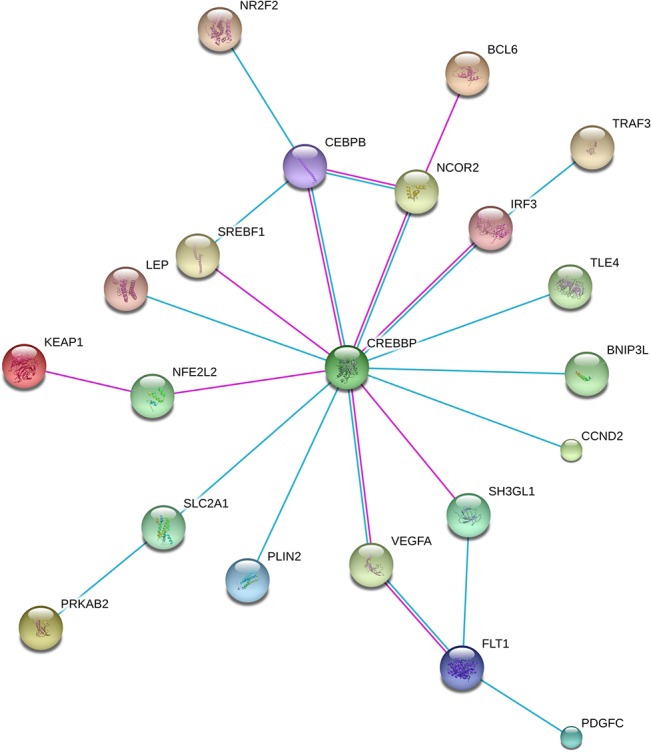
Fig 3. Protein interaction network analysis indicates a central role for CREBBP in the preeclamptic placenta.

All 388 genes were used as input for STRING analysis and a network was built (S2 Fig). Shown are the details of CREBBP interactions based on high confidence (0.8) evidence from experimental protein-protein interaction (blue lines) and curated (purple lines) databases. Proteins are indicated by nodes labeled with the encoding gene symbol. The network is enriched in interactions (p = 2.17E-13) [30].
