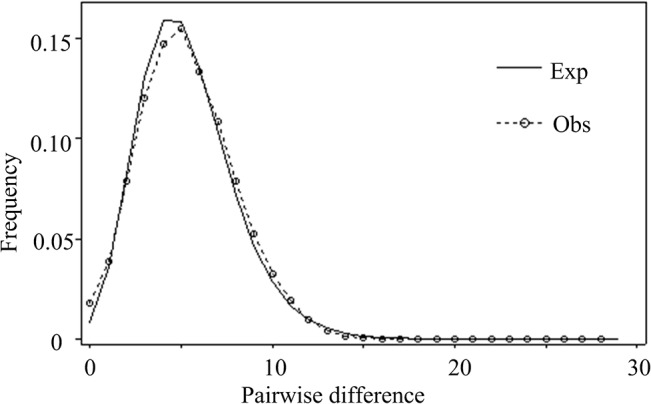
Fig 4. Mismatch distribution of Thais clavigera based on COI.

The dotted line with circles represents the observed distribution, whereas the solid line shows the expected value under the sudden demographic expansion model.

The dotted line with circles represents the observed distribution, whereas the solid line shows the expected value under the sudden demographic expansion model.