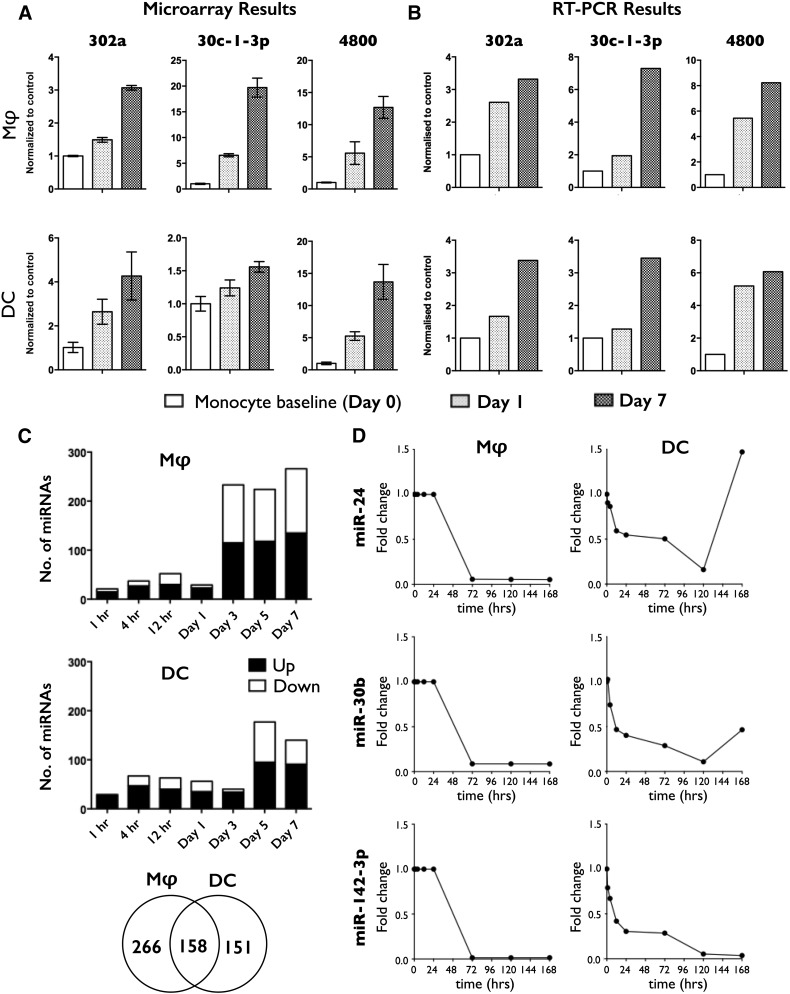
Figure 2. miRNA expression during monocyte-to-Mφ and -DC differentiation.
(A) miRNA expression during monocyte-to-Mφ and monocyte-to-DC was profiled by microarray analysis. (B) Validation of microarray results by quantitative RT-PCR by use of a second cohort (n = 2) of donors. Select miRNAs, identified as being differentially expressed by microarray, are shown. (C) Number of up-regulated (filled sections of bars) and down-regulated (open sections of bars) miRNAs over time. Venn diagram displays the total number of differentially expressed miRNAs divided into mD-Mφ specific (left segment), mD-DC specific (right segment), and common (middle segment). (D) Expression of miR-24, miR-30b, and miR-142-3p by mD-Mφ (left) and mD-DC (right) during differentiation. LogFC(logarithmic fold change) > 1.5, P < 0.05 was considered to constitute significant, differential expression. Data represent 4 biologic donors.

