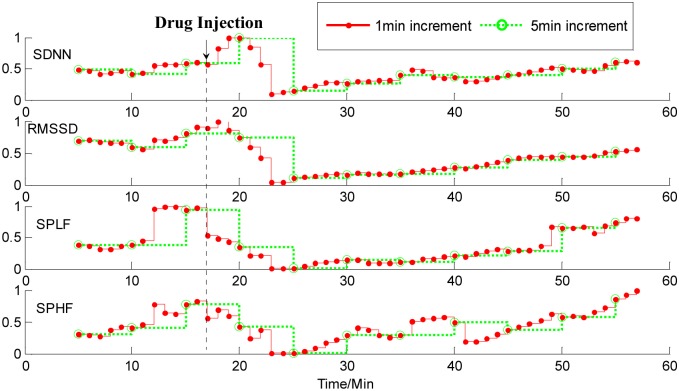
Fig 8. Time courses of measures of HRV analysis on ECG data from a dog with1-min increment (red solid line) and 5-min increment (green dotted line).
Four rows from top to bottom correspond to the SDNN (standard deviation of the normal-to-normal intervals), RMSSD (square root of the mean squared differences of successive intervals), SPLF (power spectrum in low frequency), and SPHF (power spectrum in high frequency) components. Following the application of atropine, all the four measures of HRV analysis with 1-min increment instantly decreased and reached their minimum values within about seven minutes, and then gradually increased. With a 5-min increment, the four measures began to decrease about three minutes later after giving atropine.

