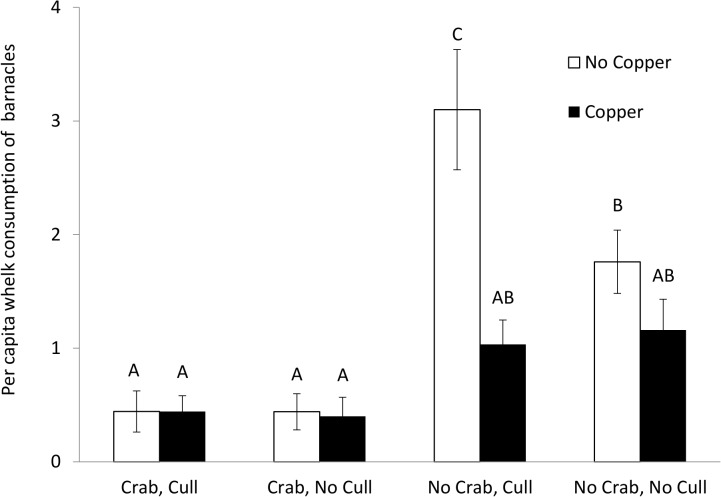
Fig 3. Effects of copper, crab predator, and culling on whelk consumption rates.
Mean (±SEM) per capita whelk consumption of barnacles under Copper (No Copper, Copper; n = 5), Crab (Crab, No Crab; n = 5), and Culling (Cull, No Cull; n = 5) treatments. Empty bars represent No Copper treatments. Filled bars represent 50 ppb Copper treatments. Per capita whelk consumption of barnacles was calculated as total number of barnacles consumed by whelks divided with the average number of experimental whelks in each replicate. Different letters indicate significantly different groups (Tukey HSD tests, p < 0.05).

