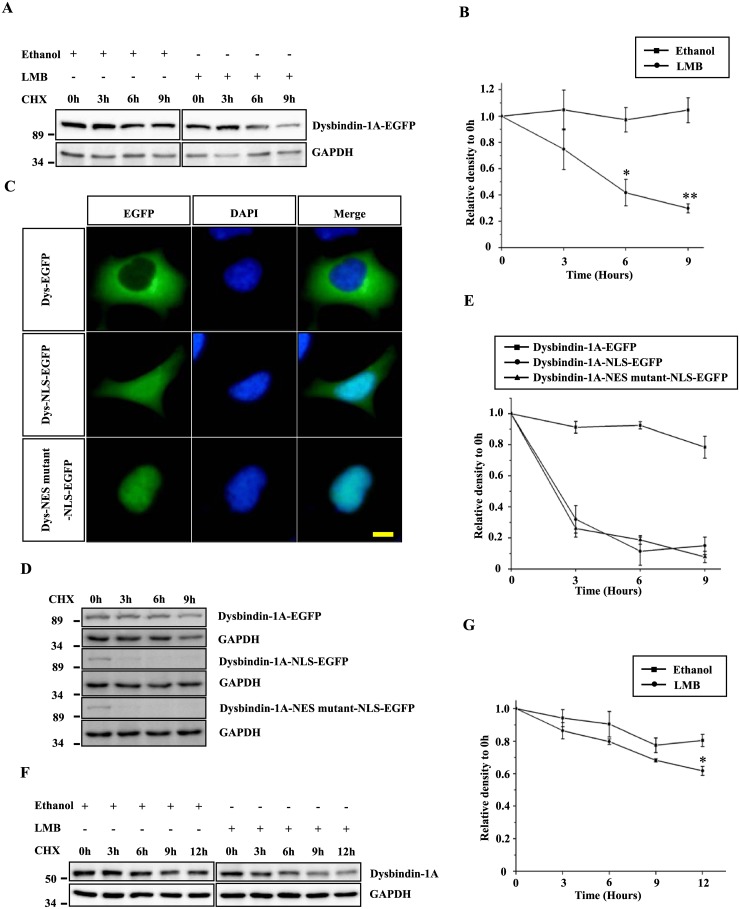
Fig 1. Dysbindin-1A is degraded in the nucleus.
(A) HEK293 cells that had been transfected with dysbindin-1A-EGFP were pre-treated with leptomycin B 20 ng/ml or equal volumes of ethanol for 1 hour, respectively. The cells were then treated with CHX for the indicated time, and cell extracts were subjected to immunoblot analysis. (B) The band intensity of dysbindin-1A-EGFP relative to GAPDH is shown. The values shown represent the means ± S.E. of three independent experiments. *, P<0.05; **, P<0.01; one-way ANOVA. (C) Subcellular localization of dysbindin-1A-EGFP and its variants that harbor a nuclear localization signal and/or a nuclear export signal mutant. HEK293 cells were transfected with the indicated plasmids, and the nuclei were stained with DAPI; The bar represents 10 μm. (D) The half-life of dysbindin-1A-NLS or the NES mutant was shorter than that of wild type dysbindin-1A. Dysbindin-1A-EGFP, dysbindin-1A-NLS-EGFP and dysbindin-1A-NES mutant-NLS-EGFP were transfected into HEK293 cells for 24 hours; the cells were then treated with CHX (100 μg/ml) for the indicated time. (E) The data from three independent experiments of (D) were quantified. The values shown represent means ± S.E. (F) The HEK293 cells were pre-treated with leptomycin B 20 ng/ml or equal volumes of ethanol for 1 hour, respectively. The cells were then treated with CHX for the indicated time, and cell extracts were subjected to immunoblot analysis. (G) The quantified analysis from three independent experiments of (F). The values shown represent the means ± S.E. *, P<0.05; one-way ANOVA.

