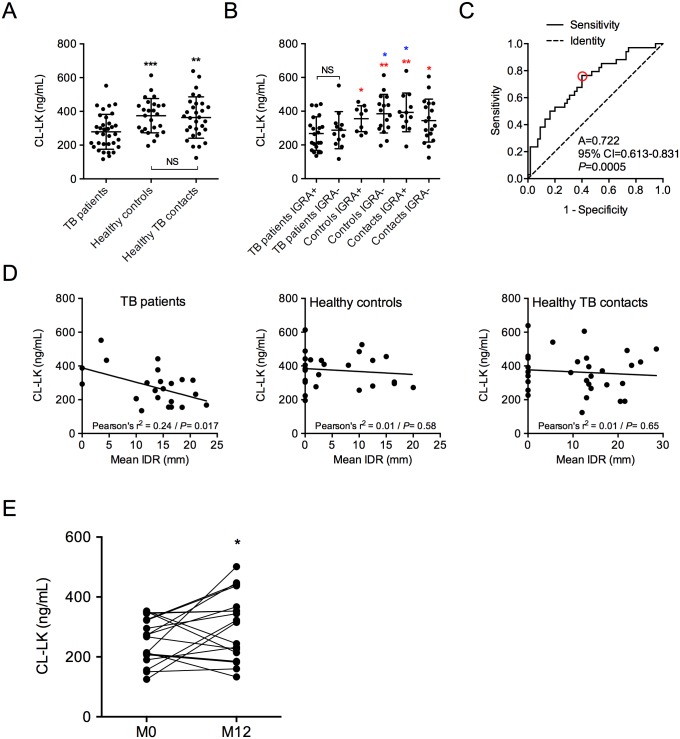
Fig 2. CL-LK is diminished in the serum of patients with TB.
CL-LK was quantified by ELISA in the serum of TB patients (n = 34), healthy controls (n = 25) and healthy TB patients’ contacts (n = 30). (A) CL-LK concentration according to health status. (B) CL-LK concentration according to health status and IGRA status. (C) ROC curves of CL-LK concentration in TB patients and healthy individuals. The red circle indicates best detection threshold (334 ng/mL) with a sensitivity of 0.76 and a specificity of 0.6. A, area under the curve; CI, confidence interval. (D) Correlation analysis between CL-LK concentration in the serum and mean IDR size (mm) in TB patients (left), healthy controls (center) and healthy TB patients’ contact individuals (right). (E) CL-LK concentration in TB patients before (M0) and after (M12) 12 months of treatment. In (A), (B) and (E), data were analyzed using the Student’s t test; *, P<0.05; **, P<0.01; ***, P<0.001; NS, not significant. In (B) red stars indicate comparison with IGRA+ TB patients, blue stars indicate comparison with IGRA- TB Patients.

