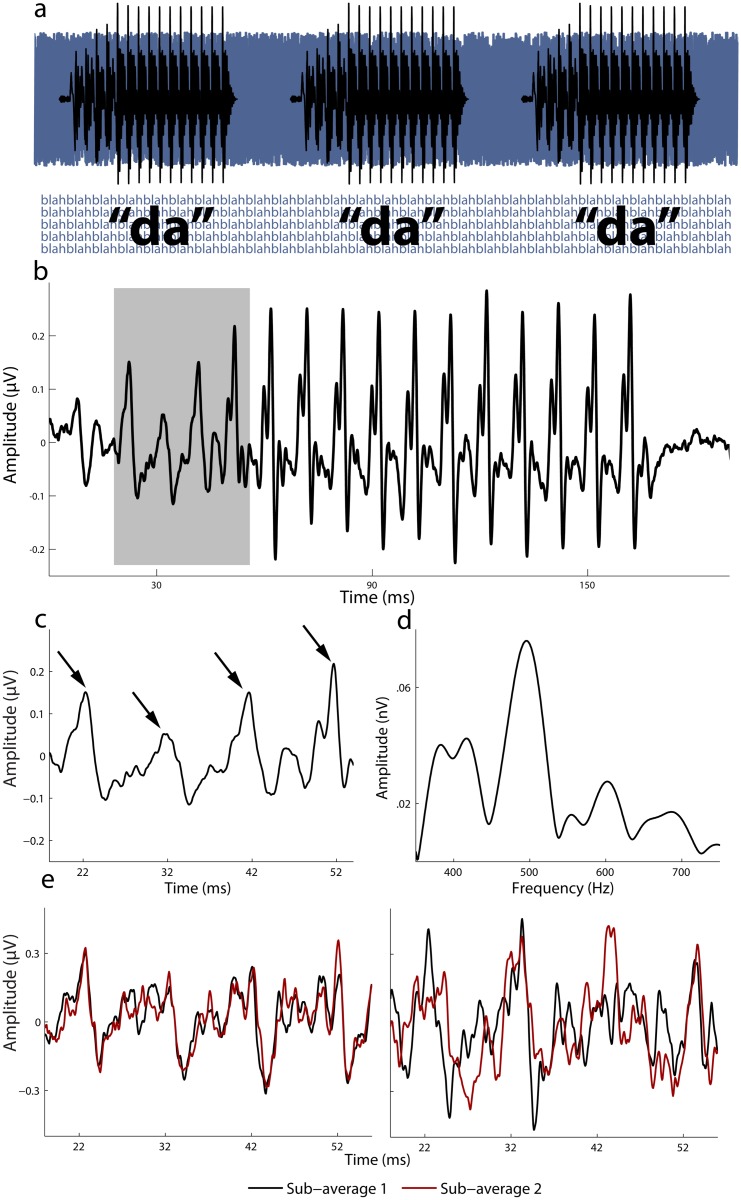
Fig 1. Overview of the auditory-neurophysiological biomarker and three derived neural measures.
(A) Recording paradigm: [da] is presented repeatedly over a continuous background track of nonsense sentences spoken by multiple talkers. (B) A time-domain average waveform of the response. The response shows many of the physical characteristics of the eliciting stimulus. The gray box highlights the time region of the response that corresponds to the consonant transition (the region of interest). (C) The peaks of interest are identified here with arrows. (D) A frequency domain representation of the grand average response to the consonant transition. (E) To illustrate the trial-by-trial stability measure, two representative subjects are shown. One pair of sub-averages each is shown for a subject with high stability and one with poor stability (right).

