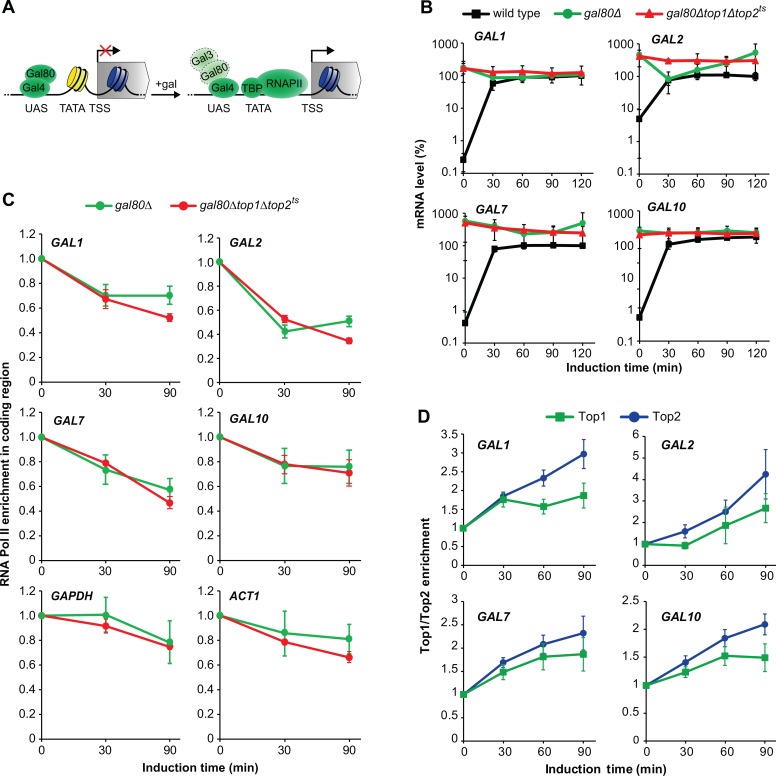
Fig 2. Topoisomerase activity has a direct role in GAL gene activation but is not required for transcriptional elongation and reinitiation.
(A) Overview of promoter changes during transcriptional induction of the GAL genes. (left) In raffinose, the GAL gene promoter is covered by nucleosomes except at the UAS, which binds Gal4 having its activation domain blocked by Gal80. (right) Upon galactose addition, Gal3 binds Gal80, leaving the activation domain of Gal4 free to bind chromatin remodelers. Subsequent removal of promoter nucleosomes allows recruitment of TBP and RNA polymerase II. UAS, Upstream Activating Sequence. TATA, TATA box. TSS, Transcription Start Site. gal, galactose. Light coloring and dashed borders of Gal3 and Gal80 indicate that the enzymes do not block the Gal4 activation domain, either due to dissociation or rearrangement of the complex. (B) Time course experiment of GAL1, GAL2, GAL7, and GAL10 transcription in wild type, gal80Δ, and gal80Δtop1Δtop2 ts cells. Cells were treated as in Fig 1B, and mRNA levels of the individual genes were quantified by qPCR, normalized to the wild type level at the latest time point (set to 100%), and presented on a log10-scale. The average from two individual experiments is shown, and error bars represent ± one standard deviation. (C) Time course experiment with ChIP analysis of RNA polymerase II enrichment in the coding regions of the GAL genes and two control genes, GAPDH and ACTI, following transcriptional activation. Cells were treated as in Fig 1B, and ChIP was performed with antibodies recognizing the C-terminal domain of the Rpb1 subunit of RNA polymerase II. RNA polymerase II binding levels were normalized relative to the binding at the 0 min time point (set to 1). (D) Time course experiment with ChIP analysis of Top1 and Top2 enrichment in the promoters of the GAL genes following transcriptional activation. Cells expressing the endogenous Top1 or Top2 enzymes fused to a cMyc tag were treated as described in Fig 1B, and ChIP was performed with antibodies recognizing the cMyc tag. Top1 and Top2 binding levels were normalized as in (C). In (C) and (D) averages from three individual experiments are shown, and error bars represent ± one standard deviation. Positions of primers used in the ChIP experiments for the individual GAL genes are indicated with arrows in Fig 1A and presented in Table 2.

