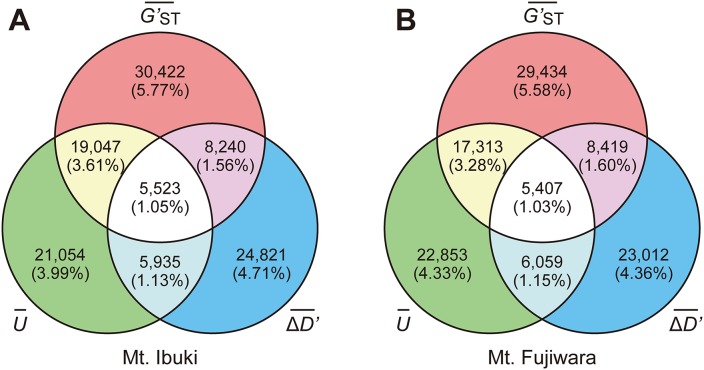
Fig 4. Overlap of screened SNPs among the three criteria.
Venn diagram shows the overlaps of screened SNPs among the three criteria. The number of SNPs that fulfilled all three criteria were 5,523 (1.05% of the 527,225 SNPs) in Mt. Ibuki (A) and 5,407 (1.03% of the 527,225 SNPs) in Mt. Fujiwara (B).

