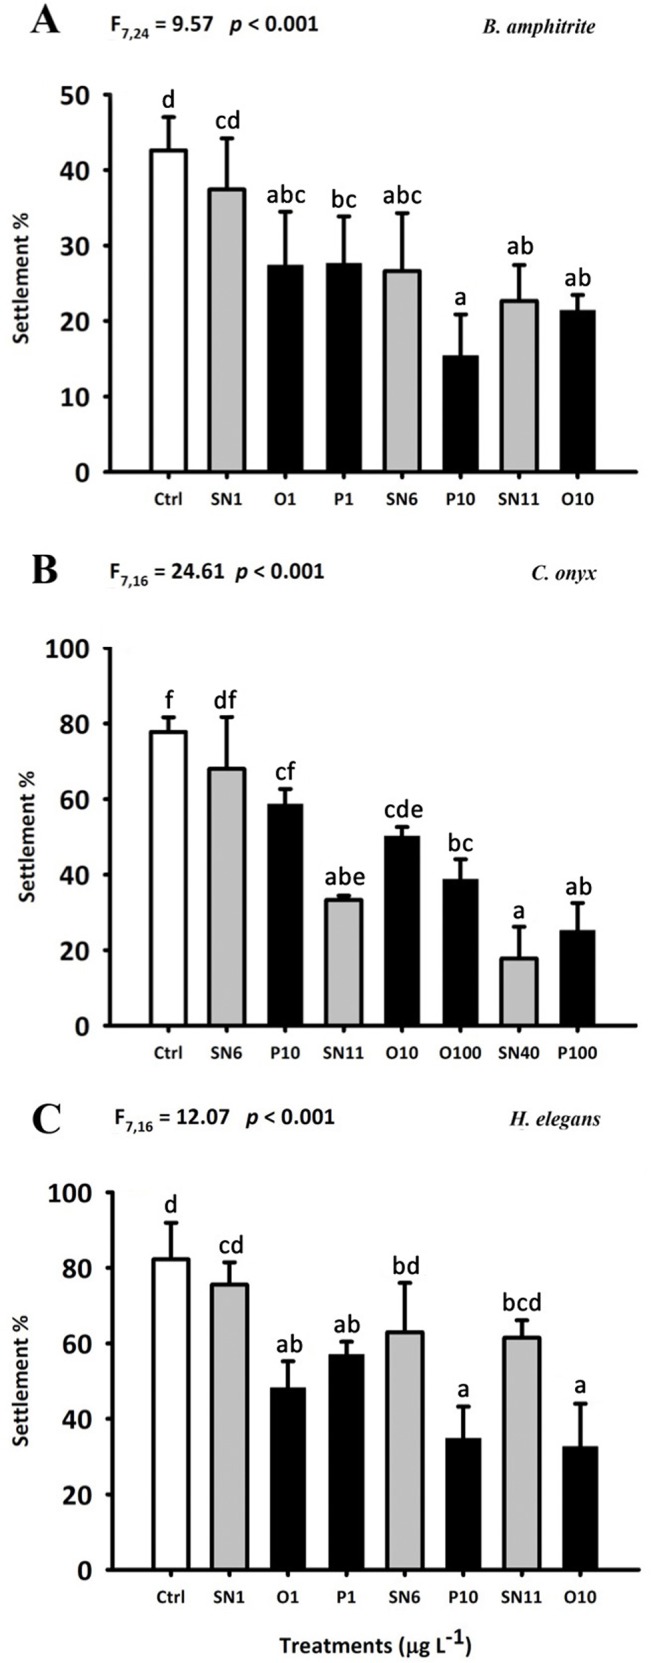
Fig 5. Effect of OAgNPs, PAgNPs and AgNO3 on the larval settlement of B. amphitrite (A), C. onyx (B) and H. elegans (C).

Each bar represents the mean (+ SD) of four replicates (A) or three replicates (B-C). One-way ANOVA was used for the statistics analysis. Different letters above the bar indicate the means that are significantly different as identified by Tukey’s test. Ctrl: FSW control, SN: AgNO3, O: OAgNP and P: PAgNP.
