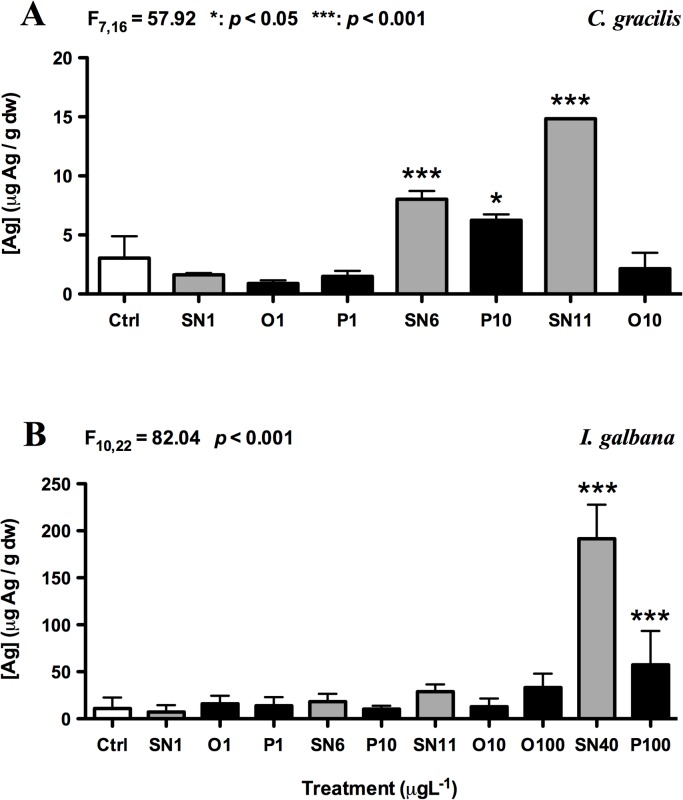
Fig 8. Total silver uptake (μg g-1 dw) by C. gracilis (A) and I. galbana (B) after 24 h of exposure.
Each bar represents the mean (+ SD) of triplicates. One-way ANOVA was used for the statistics analysis. Significant different between FSW control and treatments was identified by Tukey’s test; *: p < 0.05; ***: p < 0.001. Ctrl: FSW control, SN: AgNO3, O: OAgNP and P: PAgNP.

