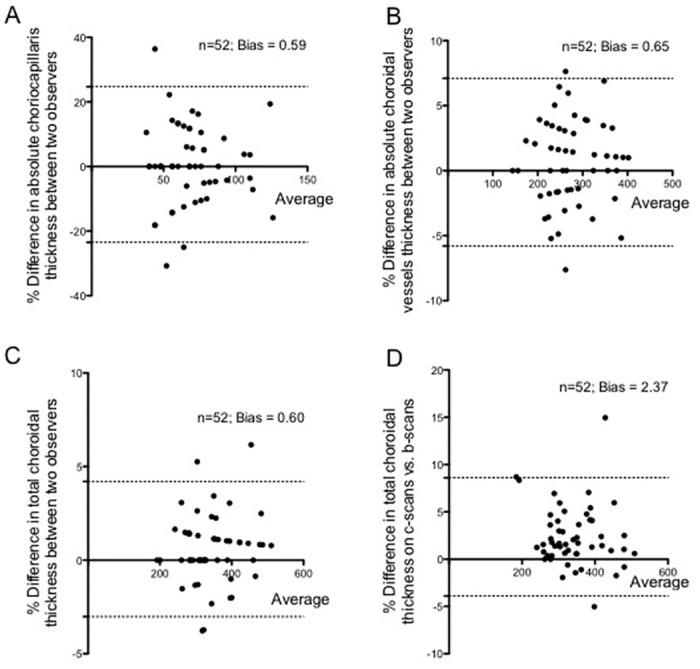
Fig 5. Bland Altman plots for internal and external validation of the method.

(A) Graph showing an agreement between two independent observers for absolute thickness of choriocapillaris. (B) Graph showing an agreement between two independent observers for absolute thickness of choroidal vessels. (C) Graph showing an agreement between two independent observers for subfoveal total choroidal thickness. (D) Graph showing an agreement in subfoveal total choroidal thickness measured on cross-sectional swept source optical coherence tomography (SS-OCT) (B-scans) and enface SS-OCT images (C-scans). n represents the number of eyes and “bias” represents the results of the Bland Altman analysis. Note that A-C represent the internal validation of the method and D represents the external validation of the method.
