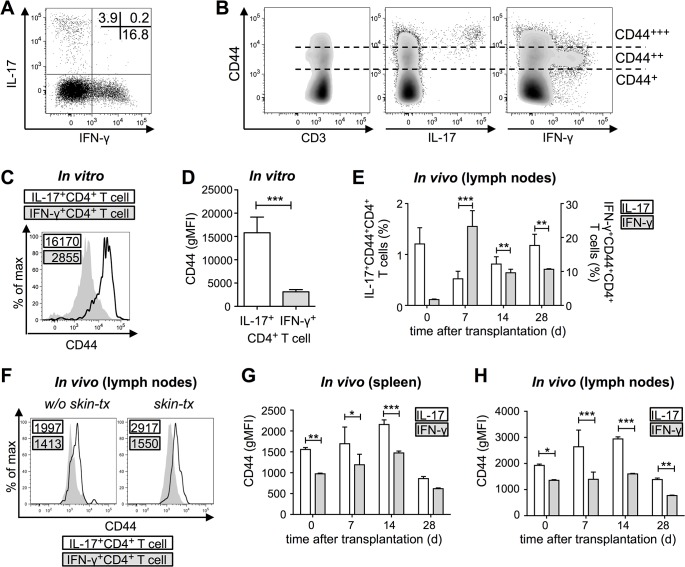
Fig 1. CD44 expression level discriminates allo-reactive IL-17+ and IFN-γ+ CD4+ T cells.
(A) Cytokine production in CD4+ T cells four days after allogeneic co-culture with bone-marrow derived dendritic cells. Percentage of cells is indicated in the dot plot. (B) CD44 subpopulations of CD4+ T cells and cytokine production within these subpopulations four days after allogeneic co-culture. (C) CD44 expression level of in vitro generated IFN-γ+CD4+ (grey) and CD4+IL17+ T cells (black line). Values for the geometric mean fluorescence intensity (gMFI) for CD44 are indicated in the histogram. (D) CD44 expression level (gMFI) of in vitro generated IL-17+CD4+ and IFN-γ+CD4+ T cells (n = 13, M ± SEM, Wilcoxon rank sum test). (E) IL-17 and IFN-γ production prior to as well as seven, 14 and 28 days after allogeneic skin transplantation (n = 3–4, M ± SEM, 2-way ANOVA and post-hoc Sidak`s multiple comparison). (F) CD44 expression level of in vivo formed IFN-γ+CD4+ (grey) and CD4+IL17+ T cells (black line) from lymph nodes after transplantation (skin-tx) and without transplantation (w/o). GMFI for CD44 is indicated in the histograms. (G) CD44 expression level (gMFI) of in vivo formed IL-17+CD4+ and IFN-γ+CD4+ T cells from spleen prior to as well as seven, 14 and 28 days after transplantation (n = 3–4, M ± SEM, 2-way ANOVA and post-hoc Sidak’s multiple comparison. (H) CD44 expression level (gMFI) of in vivo formed IL-17+CD4+ and IFN-γ+CD4+ T cells from lymph nodes after transplantation (n = 3–4 M ± SEM, 2-way ANOVA and post-hoc Sidak’s multiple comparison). Statistical significance (p) is within the groups is indicated in the figures (*p ≤ 0.05, **p ≤ 0.01, ***p ≤ 0.001).

