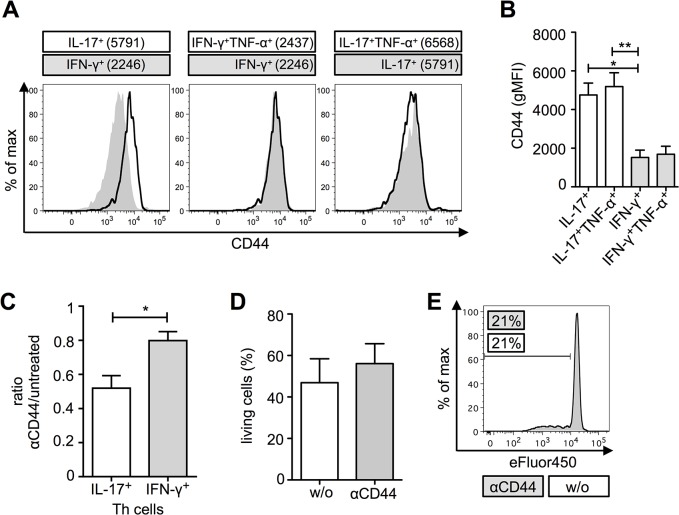
Fig 3. CD44 levels are independent of TNF-α expression and influences differentiation of IL-17+ cells.
(A) Overlay of IFN-γ+ (grey) and IL-17+ (black), IFN-γ+ (grey) and IFN-γ+TNF-α+ (black), IL-17+ (grey) and IL-17+TNF-α+ (black) CD4+ T cells regarding their CD44 expression levels. Geometric mean fluorescence intensity (gMFI) for CD44 is indicated. (B) GMFI of CD44 for IL-17 and IFN-γ single producers, as well as for IL-17/TNF-α and IFN-γ/TNF-α double producing CD4+ T cells (n = 5, M ± SEM, Friedman test and post-hoc Dunn`s comparison). (C) Ratio of IL-17+ or IFN-γ+CD4+ T cells, respectively, in αCD44-treated versus untreated co-cultures (n = 5; M ± SEM; Wilcoxon rank sum test). (D) Living cells in allogeneic co-cultures treated with or without (w/o) αCD44 (n = 5; M ± SEM; Wilcoxon rank sum test, not significant). (E) Proliferation of CD4+ T cells in allogeneic co-cultures treated with (grey) or without (w/o, black line) αCD44. Statistical significance (p) is within the groups is indicated in the figures (*p ≤ 0.05, **p ≤ 0.01, ***p ≤ 0.001).

