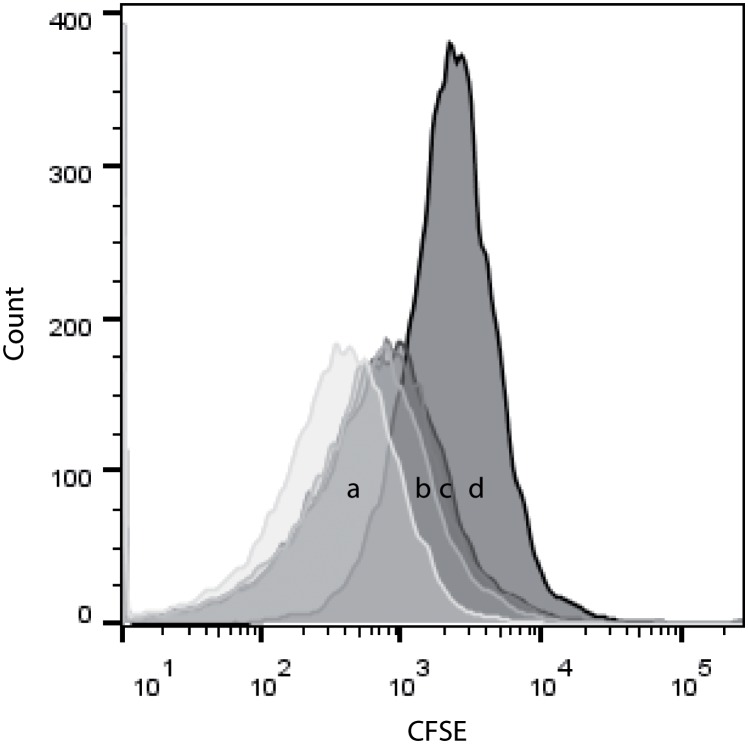
Fig 7. Histograms showing the fluorescence of CFSE stained T-cells.
(a) At day 3, the fluorescence of responders/stimulators at 1:1 ratio significantly shifted to the left when compared to the (d) fluorescence of responders alone (p = 0.02564). Effect was ratio dependent with 1:2 (b), 1:4 (c) bDCs:responders showing less decrease in fluorescence over three days than 1:1(a). Data presented are representative of three biological replicate data sets.

