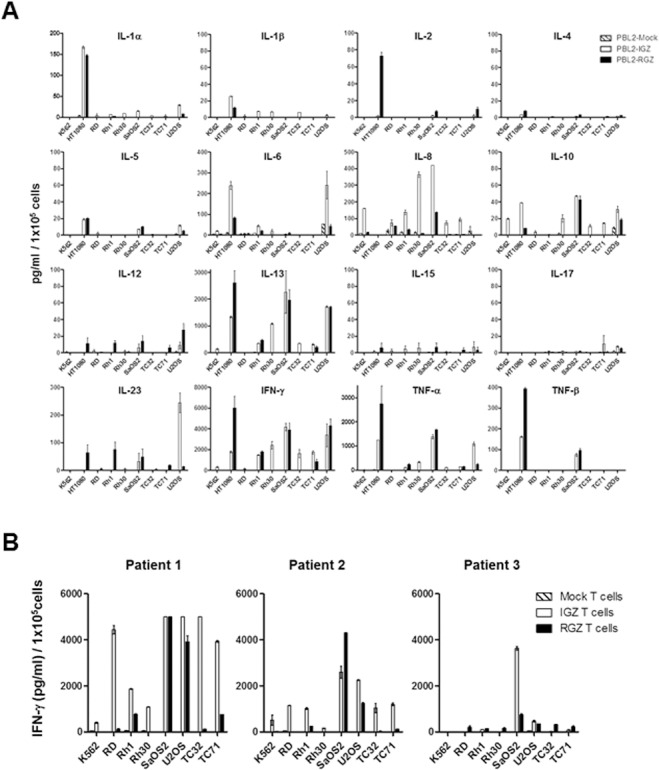
Fig 3. Cytokine profiling of IGF1R and ROR1 CAR T cells in response to sarcoma stimulation.

(A) Significant production of IFN-γ, TNF-α, and IL-13 by IGF1R and ROR1 CAR T cells derived from a healthy donor. Data shown are mean ± S.E. of duplicates. One out of two representative data is shown. (B) Antigen-specific production of IFN-γ by IGF1R and ROR1 CAR T cells derived from three sarcoma patients. Data shown are mean ± S.E. of duplicates.
