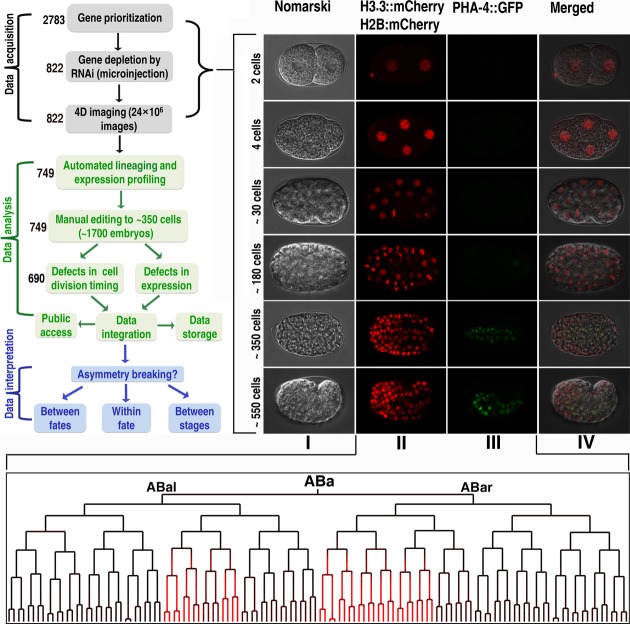
Figure 2.
Experimental design and pipeline
Top left, flowchart of this study (see also Supplementary Fig S3). Number of genes that go through each step is indicated. Top right, micrographs of Caenorhabditis elegans embryos at different developmental stages as indicated on the left. I, Nomarski micrographs of wild-type embryos at different stages; II and III, fluorescence micrographs showing the expression of lineaging and tissue markers (PHA-4) in the same embryos as those in I; IV, merged I, II and III. Bottom panel, a cell lineage tree of “ABa” along with the lineal expression of PHA-4 (colored in red) derived from fluorescence images of the lineaging and tissue markers using automated lineaging.

